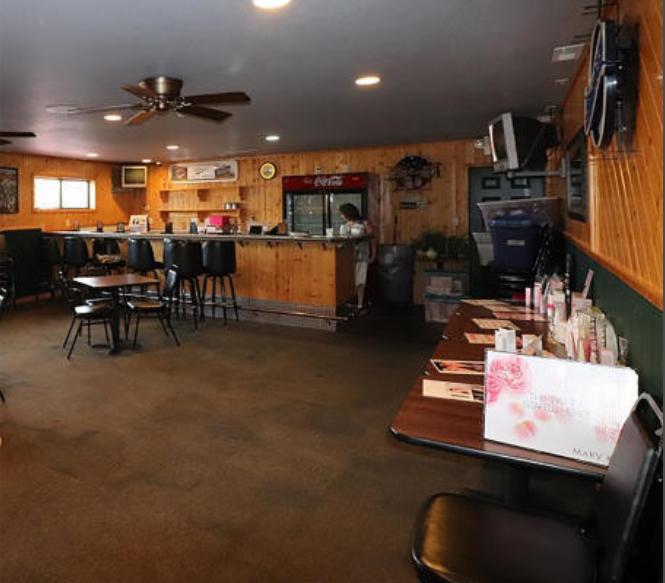
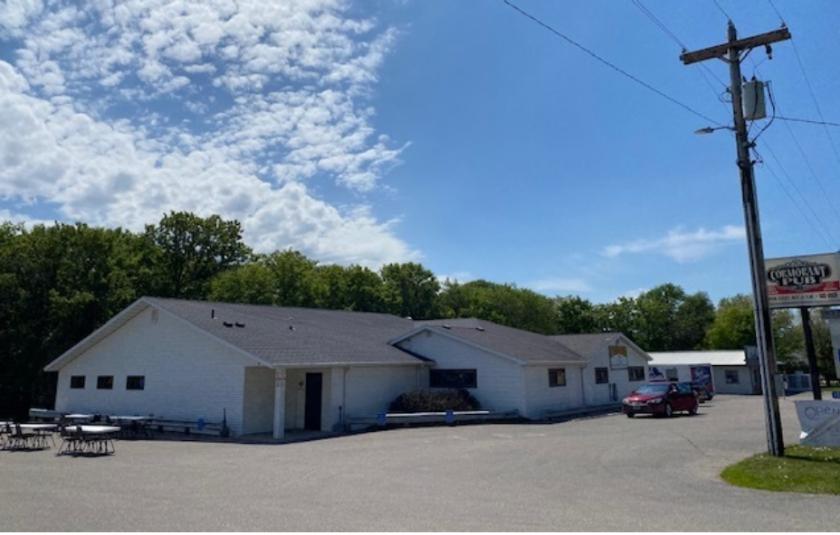
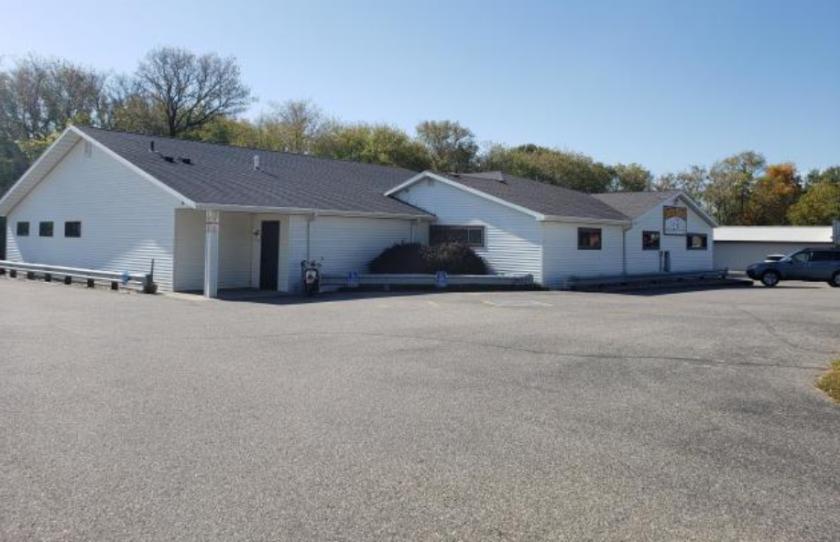
1-Mile | 3-Miles | 5-Miles | ||
---|---|---|---|---|
Total Population | 218 | 1,250 | 2,851 | |
Population Median Age | 54 | 54 | 53 | |
Population by Age | 0-9 Yrs | 10 (4%) | 72 (5%) | 188 (6%) |
10-19 Yrs | 16 (7%) | 92 (7%) | 215 (7%) | |
20-29 Yrs | 8 (3%) | 47 (3%) | 115 (4%) | |
30-39 Yrs | 13 (5%) | 78 (6%) | 187 (6%) | |
40-49 Yrs | 14 (6%) | 93 (7%) | 232 (8%) | |
50-59 Yrs | 38 (17%) | 207 (16%) | 458 (16%) | |
60-69 Yrs | 77 (35%) | 399 (31%) | 843 (29%) | |
70+ Yrs | 42 (19%) | 261 (20%) | 613 (21%) | |
Median HH Income | $72,921 | $76,111 | $78,378 | |
Total Household Income | < 24K | 11 (10%) | 60 (10%) | 131 (9%) |
25-49K | 21 (19%) | 113 (19%) | 250 (18%) | |
50-74K | 23 (21%) | 119 (20%) | 252 (19%) | |
75-99K | 14 (13%) | 89 (15%) | 212 (16%) | |
100-199K | 33 (30%) | 176 (29%) | 382 (28%) | |
200K+ | 4 (3%) | 35 (5%) | 97 (7%) | |
Highest Education Level | No Diploma | 7 | 39 | 86 |
Diploma or GED | 44 | 254 | 584 | |
Some College | 43 | 242 | 546 | |
Assoc. Degree | 24 | 132 | 291 | |
Bachelors Degree | 48 | 257 | 556 | |
Higher Degree | 24 | 146 | 340 | |
Total Housing Units | 268 | 1,569 | 3,563 | |
--Owner-Occupied | 105 | 578 | 1,285 | |
--Renter-Occupied | 2 | 14 | 39 | |
Owner-Occupied Values | < 100K | 9 | 53 | 122 |
100-199K | 11 | 74 | 184 | |
200-299K | 17 | 89 | 196 | |
300-399K | 21 | 105 | 216 | |
400-499K | 10 | 58 | 137 | |
500K+ | 37 | 199 | 430 | |
Total Working Age Population | 196 | 1,109 | 2,507 | |
In Work Force | 115 | 624 | 1,382 | |
Not In Work Force | 81 | 484 | 1,125 | |
Workforce Employed | 105 | 579 | 1,300 | |
Workforce Unemployed | 11 | 45 | 81 | |
Civlian Workforce | 115 | 624 | 1,381 | |
Military Workforce | 0 | 0 | 1 | |
Total Households | 107 | 593 | 1,325 | |
Family Households | 80 | 444 | 987 | |
Non-Family Households | 26 | 149 | 338 | |
Married Couple | 76 | 414 | 908 | |
Other Family | 4 | 30 | 78 | |
Married w/Child | 12 | 66 | 152 | |
Single Male w/Child | 3 | 15 | 30 | |
Single Female w/Child | 0 | 2 | 9 |
Population Change Last Two Decades - Plus Projection
2000 | % | 2010 | % | 2020 | % | 2030 | |
---|---|---|---|---|---|---|---|
Minnesota | 4,919,479 | +8 | 5,303,925 | +7 | 5,687,161 | +5 | 5,974,304 |
Becker County | 30,000 | +8 | 32,504 | +6 | 34,447 | +3 | 35,544 |
Otter Tail County | 57,159 | 0 | 57,303 | +1 | 58,127 | 0 | 58,197 |
Total Working Age Population:
Total Households:
Total Working Age Population:
Total Households:
Total Working Age Population:
Total Households: