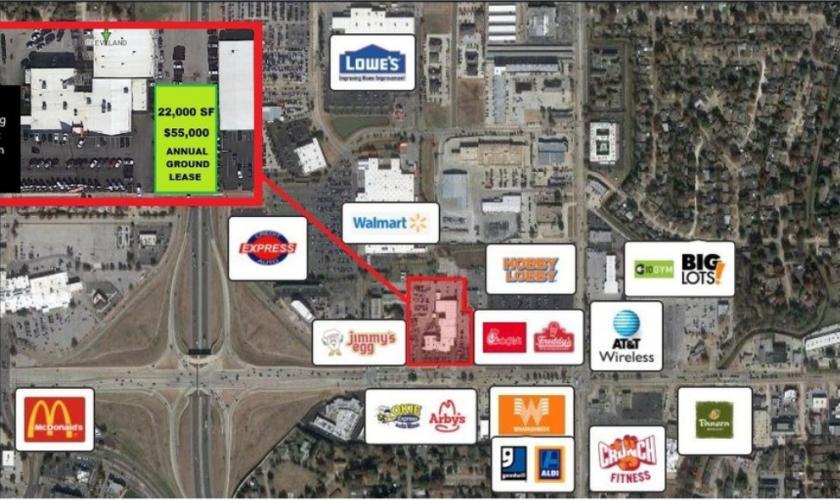
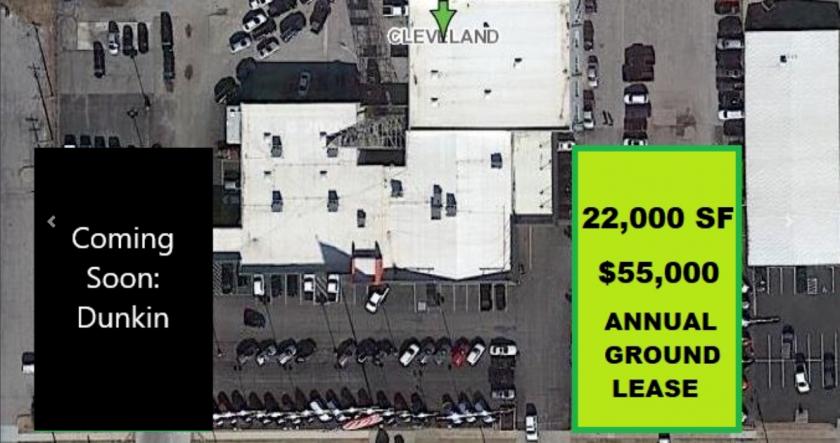
1-Mile | 3-Miles | 5-Miles | ||
---|---|---|---|---|
Total Population | 8,007 | 59,707 | 106,763 | |
Population Median Age | 41 | 36 | 35 | |
Population by Age | 0-9 Yrs | 617 (7%) | 5083 (8%) | 10345 (9%) |
10-19 Yrs | 1009 (12%) | 11532 (19%) | 17106 (16%) | |
20-29 Yrs | 1439 (17%) | 12828 (21%) | 26258 (24%) | |
30-39 Yrs | 1121 (14%) | 7767 (13%) | 14510 (13%) | |
40-49 Yrs | 867 (10%) | 6060 (10%) | 11244 (10%) | |
50-59 Yrs | 970 (12%) | 5335 (8%) | 9595 (8%) | |
60-69 Yrs | 873 (10%) | 5473 (9%) | 8911 (8%) | |
70+ Yrs | 1112 (13%) | 5629 (9%) | 8794 (8%) | |
Median HH Income | $49,082 | $53,222 | $55,458 | |
Total Household Income | < 24K | 611 (16%) | 5054 (22%) | 8848 (21%) |
25-49K | 1258 (34%) | 5851 (25%) | 10234 (24%) | |
50-74K | 635 (17%) | 4154 (18%) | 7749 (18%) | |
75-99K | 390 (10%) | 2431 (10%) | 4988 (12%) | |
100-199K | 667 (18%) | 3940 (17%) | 7301 (17%) | |
200K+ | 123 (3%) | 1344 (5%) | 2140 (5%) | |
Highest Education Level | No Diploma | 386 | 2662 | 4117 |
Diploma or GED | 1212 | 6459 | 11881 | |
Some College | 1250 | 7841 | 14553 | |
Assoc. Degree | 355 | 2098 | 4415 | |
Bachelors Degree | 1190 | 8270 | 15198 | |
Higher Degree | 1157 | 7383 | 12173 | |
Total Housing Units | 4,188 | 25,414 | 45,750 | |
--Owner-Occupied | 1,814 | 11,176 | 20,617 | |
--Renter-Occupied | 1,870 | 11,598 | 20,644 | |
Owner-Occupied Values | < 100K | 155 | 1597 | 2599 |
100-199K | 936 | 4583 | 9392 | |
200-299K | 450 | 2533 | 4574 | |
300-399K | 188 | 1270 | 2218 | |
400-499K | 54 | 449 | 779 | |
500K+ | 31 | 745 | 1054 | |
Total Working Age Population | 6,840 | 50,498 | 88,523 | |
In Work Force | 4,484 | 31,307 | 57,465 | |
Not In Work Force | 2,356 | 19,191 | 31,058 | |
Workforce Employed | 4,243 | 29,604 | 54,538 | |
Workforce Unemployed | 212 | 1,619 | 2,708 | |
Civlian Workforce | 4,456 | 31,223 | 57,246 | |
Military Workforce | 28 | 85 | 220 | |
Total Households | 3,684 | 22,773 | 41,261 | |
Family Households | 2,107 | 12,443 | 23,631 | |
Non-Family Households | 1,577 | 10,330 | 17,630 | |
Married Couple | 1,489 | 9,101 | 16,798 | |
Other Family | 618 | 3,343 | 6,833 | |
Married w/Child | 510 | 3,714 | 7,295 | |
Single Male w/Child | 191 | 689 | 1,127 | |
Single Female w/Child | 95 | 1,115 | 2,628 |
Population Change Last Two Decades - Plus Projection
2000 | % | 2010 | % | 2020 | % | 2030 | |
---|---|---|---|---|---|---|---|
Oklahoma | 3,450,654 | +9 | 3,751,351 | +7 | 4,024,202 | +7 | 4,302,501 |
Cleveland County | 208,016 | +23 | 255,755 | +15 | 294,868 | +14 | 336,050 |
McClain County | 27,740 | +24 | 34,506 | +12 | 38,671 | +11 | 42,858 |
Total Working Age Population:
Total Households:
Total Working Age Population:
Total Households:
Total Working Age Population:
Total Households: