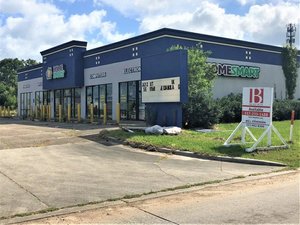
1-Mile | 3-Miles | 5-Miles | ||
---|---|---|---|---|
Total Population | 2,944 | 9,439 | 12,332 | |
Population Median Age | 36 | 38 | 38 | |
Population by Age | 0-9 Yrs | 482 (16%) | 1421 (15%) | 1789 (14%) |
10-19 Yrs | 398 (13%) | 1444 (15%) | 1959 (15%) | |
20-29 Yrs | 472 (16%) | 1222 (12%) | 1550 (12%) | |
30-39 Yrs | 351 (11%) | 1086 (11%) | 1452 (11%) | |
40-49 Yrs | 245 (8%) | 851 (9%) | 1222 (9%) | |
50-59 Yrs | 449 (15%) | 1183 (12%) | 1526 (12%) | |
60-69 Yrs | 252 (8%) | 1166 (12%) | 1517 (12%) | |
70+ Yrs | 296 (10%) | 1067 (11%) | 1317 (10%) | |
Median HH Income | $18,227 | $22,259 | $26,358 | |
Total Household Income | < 24K | 783 (60%) | 2107 (54%) | 2378 (48%) |
25-49K | 292 (22%) | 914 (23%) | 1213 (24%) | |
50-74K | 96 (7%) | 407 (10%) | 570 (11%) | |
75-99K | 77 (5%) | 242 (6%) | 379 (7%) | |
100-199K | 46 (3%) | 199 (5%) | 344 (6%) | |
200K+ | 3 (0%) | 25 (0%) | 47 (0%) | |
Highest Education Level | No Diploma | 669 | 1780 | 2135 |
Diploma or GED | 836 | 2659 | 3281 | |
Some College | 175 | 751 | 1080 | |
Assoc. Degree | 103 | 396 | 580 | |
Bachelors Degree | 71 | 356 | 660 | |
Higher Degree | 28 | 159 | 237 | |
Total Housing Units | 1,613 | 4,899 | 6,149 | |
--Owner-Occupied | 489 | 1,758 | 2,529 | |
--Renter-Occupied | 808 | 2,135 | 2,401 | |
Owner-Occupied Values | < 100K | 338 | 1130 | 1510 |
100-199K | 95 | 413 | 622 | |
200-299K | 46 | 150 | 277 | |
300-399K | 11 | 61 | 97 | |
400-499K | 0 | 1 | 6 | |
500K+ | 0 | 4 | 17 | |
Total Working Age Population | 2,257 | 7,259 | 9,519 | |
In Work Force | 1,162 | 3,872 | 5,260 | |
Not In Work Force | 1,095 | 3,387 | 4,258 | |
Workforce Employed | 993 | 3,348 | 4,574 | |
Workforce Unemployed | 168 | 523 | 684 | |
Civlian Workforce | 1,161 | 3,871 | 5,258 | |
Military Workforce | 1 | 1 | 2 | |
Total Households | 1,298 | 3,893 | 4,931 | |
Family Households | 683 | 2,265 | 3,029 | |
Non-Family Households | 615 | 1,628 | 1,902 | |
Married Couple | 259 | 999 | 1,525 | |
Other Family | 424 | 1,266 | 1,504 | |
Married w/Child | 81 | 305 | 471 | |
Single Male w/Child | 40 | 198 | 267 | |
Single Female w/Child | 222 | 629 | 743 |
Population Change Last Two Decades - Plus Projection
2000 | % | 2010 | % | 2020 | % | 2030 | |
---|---|---|---|---|---|---|---|
Louisiana | 4,468,976 | +1 | 4,533,372 | +1 | 4,588,310 | +5 | 4,813,420 |
Evangeline Parish | 35,434 | -4 | 33,984 | +6 | 36,040 | -1 | 35,800 |
St. Landry Parish | 87,700 | -5 | 83,384 | +15 | 95,890 | +2 | 98,080 |
Total Working Age Population:
Total Households:
Total Working Age Population:
Total Households:
Total Working Age Population:
Total Households: