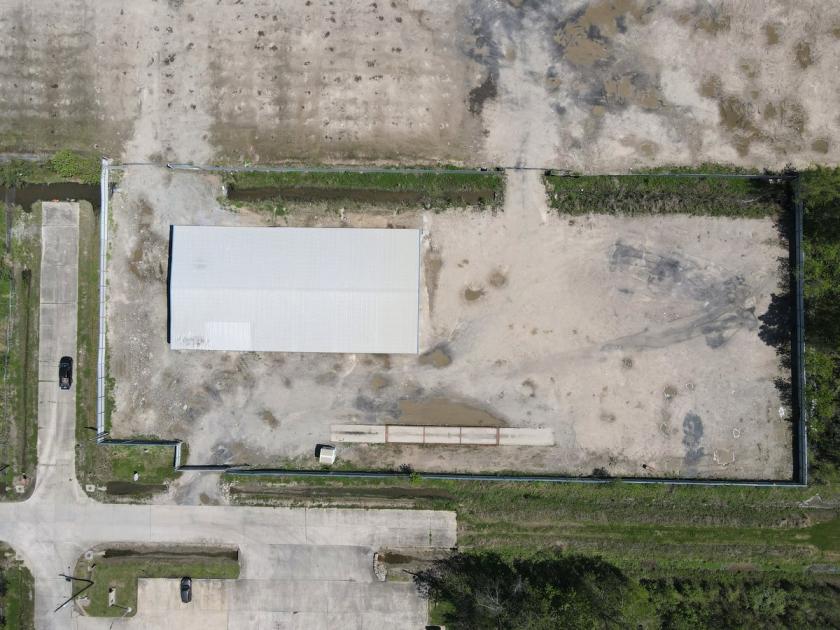
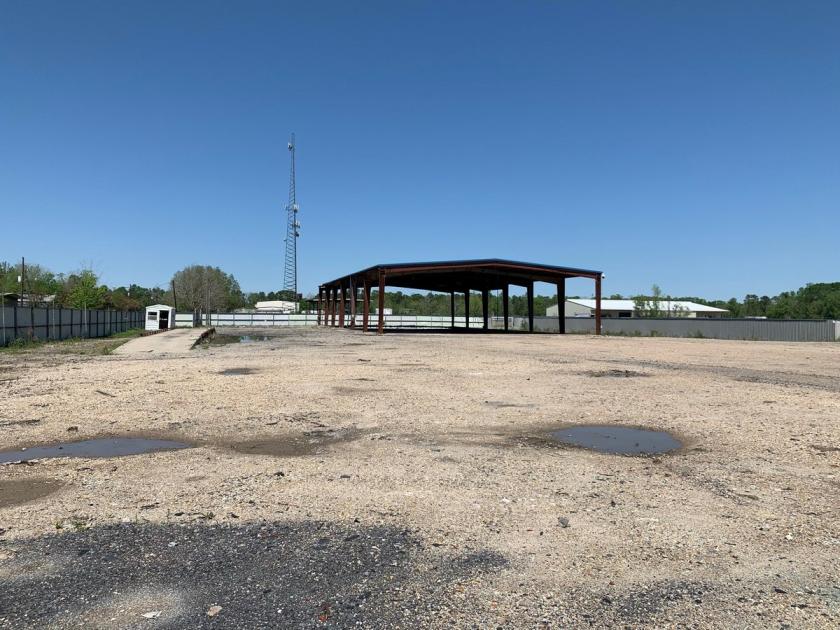
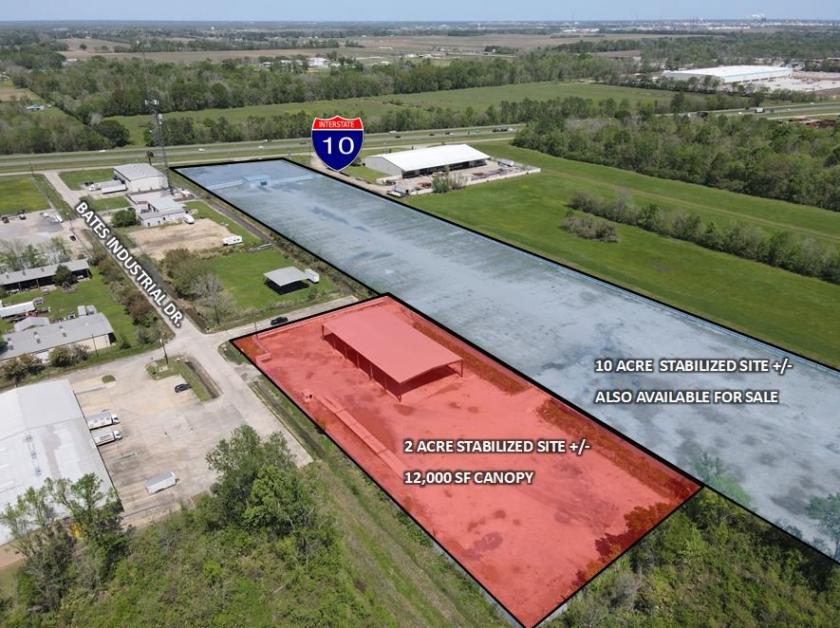
1-Mile | 3-Miles | 5-Miles | ||
---|---|---|---|---|
Total Population | 73 | 5,992 | 25,884 | |
Population Median Age | 40 | 39 | 38 | |
Population by Age | 0-9 Yrs | 8 (10%) | 847 (14%) | 3026 (11%) |
10-19 Yrs | 8 (10%) | 647 (10%) | 3153 (12%) | |
20-29 Yrs | 8 (10%) | 890 (14%) | 4281 (16%) | |
30-39 Yrs | 10 (13%) | 773 (12%) | 3810 (14%) | |
40-49 Yrs | 9 (12%) | 691 (11%) | 3156 (12%) | |
50-59 Yrs | 18 (24%) | 748 (12%) | 3058 (11%) | |
60-69 Yrs | 7 (9%) | 831 (13%) | 3141 (12%) | |
70+ Yrs | 5 (6%) | 564 (9%) | 2259 (8%) | |
Median HH Income | $63,301 | $53,814 | $51,220 | |
Total Household Income | < 24K | 2 (6%) | 620 (26%) | 2907 (27%) |
25-49K | 5 (17%) | 480 (20%) | 2282 (21%) | |
50-74K | 9 (31%) | 414 (17%) | 1883 (17%) | |
75-99K | 2 (6%) | 376 (15%) | 1123 (10%) | |
100-199K | 5 (17%) | 385 (16%) | 1941 (18%) | |
200K+ | 6 (20%) | 95 (4%) | 443 (4%) | |
Highest Education Level | No Diploma | 2 | 659 | 2678 |
Diploma or GED | 20 | 1548 | 5533 | |
Some College | 10 | 887 | 3489 | |
Assoc. Degree | 1 | 242 | 1267 | |
Bachelors Degree | 13 | 496 | 3051 | |
Higher Degree | 8 | 296 | 1794 | |
Total Housing Units | 30 | 2,680 | 12,870 | |
--Owner-Occupied | 28 | 1,478 | 5,592 | |
--Renter-Occupied | 1 | 893 | 4,988 | |
Owner-Occupied Values | < 100K | 4 | 288 | 1065 |
100-199K | 2 | 500 | 1821 | |
200-299K | 11 | 579 | 1986 | |
300-399K | 6 | 72 | 515 | |
400-499K | 3 | 28 | 117 | |
500K+ | 1 | 13 | 86 | |
Total Working Age Population | 58 | 4,801 | 21,626 | |
In Work Force | 39 | 2,782 | 13,245 | |
Not In Work Force | 19 | 2,019 | 8,381 | |
Workforce Employed | 37 | 2,635 | 12,203 | |
Workforce Unemployed | 1 | 134 | 992 | |
Civlian Workforce | 39 | 2,769 | 13,195 | |
Military Workforce | 0 | 13 | 50 | |
Total Households | 29 | 2,371 | 10,580 | |
Family Households | 26 | 1,597 | 5,807 | |
Non-Family Households | 4 | 774 | 4,772 | |
Married Couple | 16 | 874 | 3,652 | |
Other Family | 9 | 723 | 2,155 | |
Married w/Child | 5 | 253 | 1,214 | |
Single Male w/Child | 0 | 51 | 187 | |
Single Female w/Child | 3 | 339 | 829 |
Population Change Last Two Decades - Plus Projection
2000 | % | 2010 | % | 2020 | % | 2030 | |
---|---|---|---|---|---|---|---|
Louisiana | 4,468,976 | +1 | 4,533,372 | +1 | 4,588,310 | +5 | 4,813,420 |
East Baton Rouge Parish | 412,852 | +7 | 440,171 | -3 | 426,380 | -1 | 421,500 |
Iberville Parish | 33,320 | 0 | 33,387 | -17 | 27,830 | -11 | 24,640 |
Pointe Coupee Parish | 22,763 | 0 | 22,802 | -8 | 20,920 | -7 | 19,380 |
St. Martin Parish | 48,583 | +7 | 52,160 | +6 | 55,520 | +3 | 57,000 |
West Baton Rouge Parish | 21,601 | +10 | 23,788 | -7 | 22,220 | -5 | 21,070 |
Total Working Age Population:
Total Households:
Total Working Age Population:
Total Households:
Total Working Age Population:
Total Households: