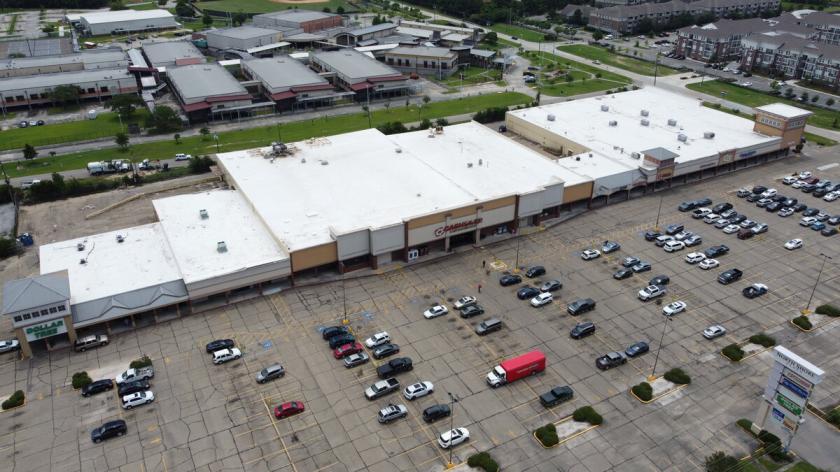
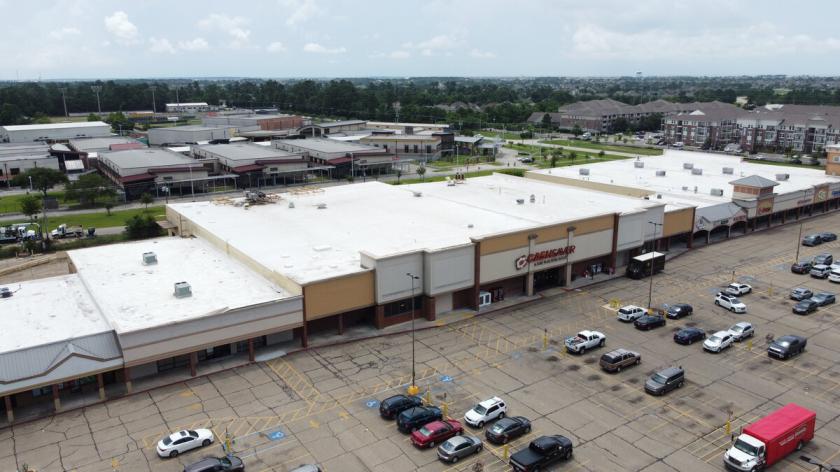
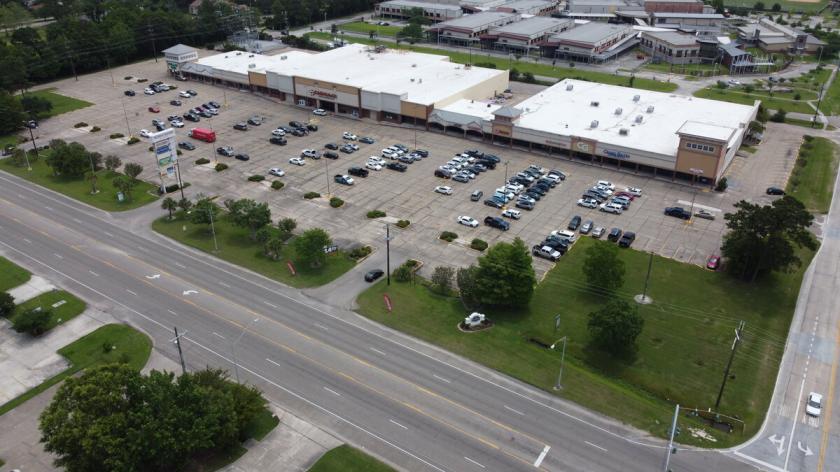
1-Mile | 3-Miles | 5-Miles | ||
---|---|---|---|---|
Total Population | 5,435 | 38,472 | 75,284 | |
Population Median Age | 39 | 41 | 40 | |
Population by Age | 0-9 Yrs | 790 (14%) | 4610 (11%) | 9560 (12%) |
10-19 Yrs | 560 (10%) | 4279 (11%) | 9743 (12%) | |
20-29 Yrs | 756 (13%) | 4656 (12%) | 8621 (11%) | |
30-39 Yrs | 828 (15%) | 4901 (12%) | 9902 (13%) | |
40-49 Yrs | 512 (9%) | 4437 (11%) | 9400 (12%) | |
50-59 Yrs | 704 (12%) | 5502 (14%) | 9943 (13%) | |
60-69 Yrs | 775 (14%) | 5497 (14%) | 9793 (13%) | |
70+ Yrs | 508 (9%) | 4590 (11%) | 8323 (11%) | |
Median HH Income | $51,665 | $52,999 | $58,980 | |
Total Household Income | < 24K | 556 (27%) | 3729 (24%) | 5767 (20%) |
25-49K | 425 (21%) | 3536 (23%) | 6110 (21%) | |
50-74K | 317 (15%) | 2313 (15%) | 4629 (16%) | |
75-99K | 247 (12%) | 2180 (14%) | 4464 (16%) | |
100-199K | 360 (17%) | 2590 (17%) | 5502 (19%) | |
200K+ | 103 (5%) | 870 (5%) | 1388 (4%) | |
Highest Education Level | No Diploma | 494 | 3419 | 6188 |
Diploma or GED | 1292 | 8347 | 15604 | |
Some College | 847 | 7089 | 13826 | |
Assoc. Degree | 234 | 2028 | 3792 | |
Bachelors Degree | 601 | 4081 | 8034 | |
Higher Degree | 309 | 2405 | 4372 | |
Total Housing Units | 2,140 | 17,019 | 30,817 | |
--Owner-Occupied | 1,428 | 10,205 | 19,859 | |
--Renter-Occupied | 580 | 5,013 | 8,001 | |
Owner-Occupied Values | < 100K | 274 | 1277 | 2326 |
100-199K | 649 | 3992 | 9495 | |
200-299K | 274 | 2741 | 4979 | |
300-399K | 179 | 1508 | 2058 | |
400-499K | 20 | 383 | 514 | |
500K+ | 32 | 304 | 487 | |
Total Working Age Population | 4,299 | 31,323 | 59,590 | |
In Work Force | 2,726 | 19,195 | 37,228 | |
Not In Work Force | 1,573 | 12,128 | 22,362 | |
Workforce Employed | 2,413 | 17,523 | 34,137 | |
Workforce Unemployed | 257 | 1,524 | 2,744 | |
Civlian Workforce | 2,670 | 19,047 | 36,882 | |
Military Workforce | 55 | 149 | 346 | |
Total Households | 2,008 | 15,218 | 27,860 | |
Family Households | 1,346 | 9,501 | 18,547 | |
Non-Family Households | 662 | 5,717 | 9,313 | |
Married Couple | 801 | 6,409 | 12,730 | |
Other Family | 545 | 3,092 | 5,817 | |
Married w/Child | 249 | 1,774 | 4,375 | |
Single Male w/Child | 94 | 395 | 704 | |
Single Female w/Child | 189 | 1,280 | 2,440 |
Population Change Last Two Decades - Plus Projection
2000 | % | 2010 | % | 2020 | % | 2030 | |
---|---|---|---|---|---|---|---|
Louisiana | 4,468,976 | +1 | 4,533,372 | +1 | 4,588,310 | +5 | 4,813,420 |
Orleans Parish | 484,674 | -29 | 343,829 | -26 | 255,440 | 0 | 256,010 |
St. Bernard Parish | 67,229 | -47 | 35,897 | -38 | 22,210 | +1 | 22,480 |
St. Tammany Parish | 191,268 | +22 | 233,740 | +45 | 338,300 | +36 | 459,160 |
Total Working Age Population:
Total Households:
Total Working Age Population:
Total Households:
Total Working Age Population:
Total Households: