Commercial Land
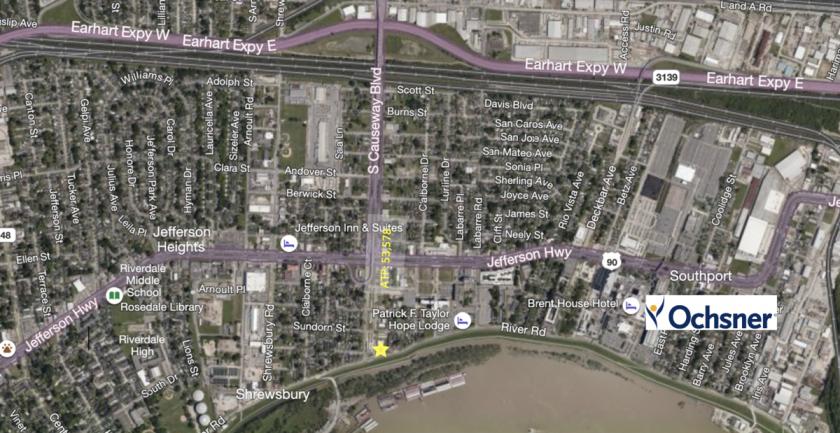
101 North Causeway Boulevard Metairie, LA 70001
101 North Causeway Boulevard Metairie, LA 70001
Details & Description
Property Highlights
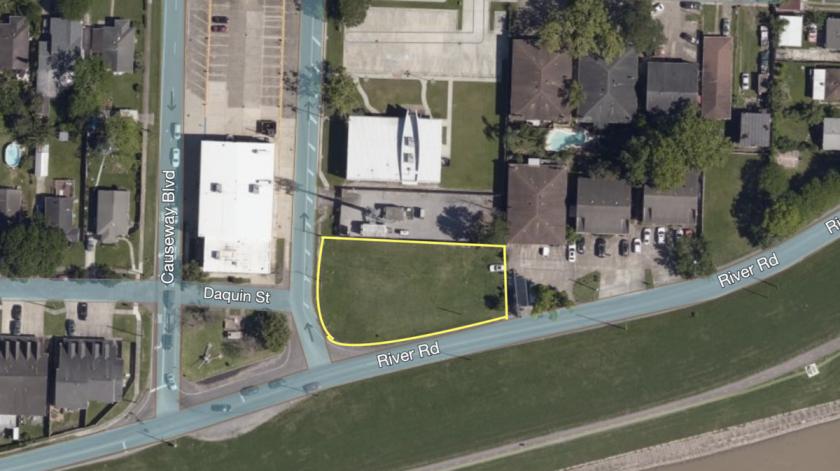
• - 13,000 SF available at the corner of Causeway and River Road
• Contact agent for more details.
Listing Agents

Burden Edmonds
O: 225-931-9222
bedmonds@beaubox.com
O: 225-931-9222
bedmonds@beaubox.com
While we strive to provide the most accurate information, all listing information, and demographic data, is provided by third-parties. As such, MyEListing will not be responsible for the accuracy of the information. It is strongly recommended that you verify all information with the listing agent, and any relevant agencies, prior to making any decisions.