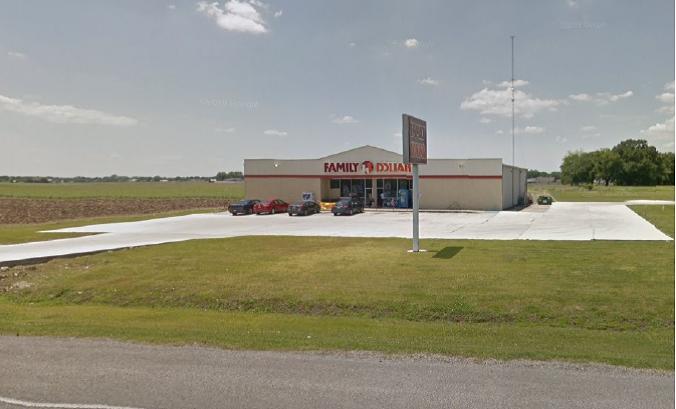
Retail Space
122 Louisiana 398 Labadieville, LA 70372
122 Louisiana 398 Labadieville, LA 70372
Details & Description
Property Highlights
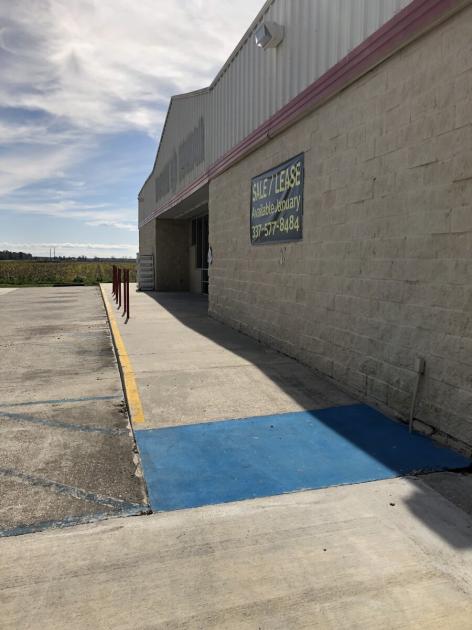
- • Former Family Dollar building for Sale or Lease
- • 2 restrooms
- • Recently Redone Paved Parking.
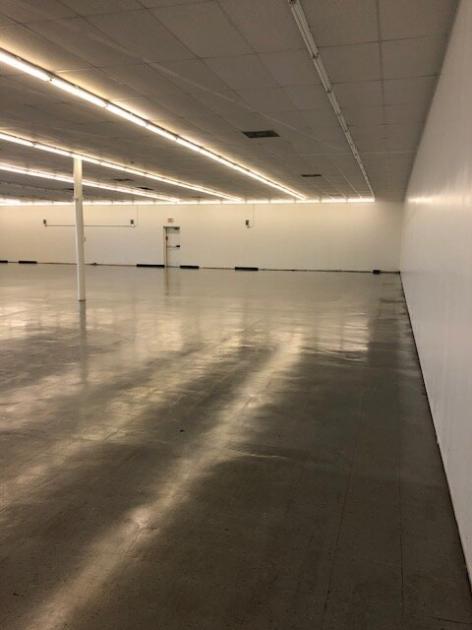
- • 16 Eave Height
- • 4 5-ton 3-Phase Air conditioning Units
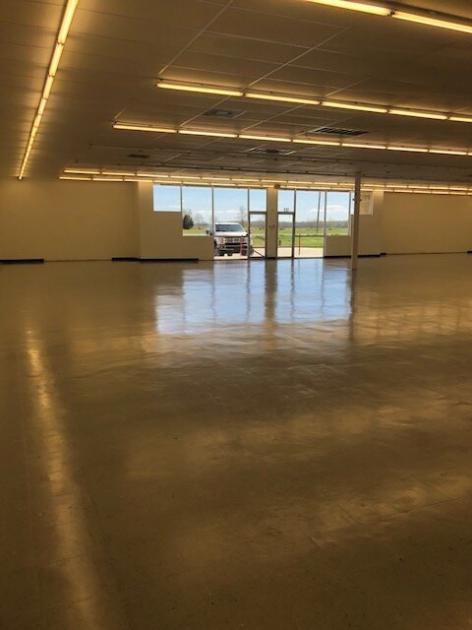
Additional Photos
Listing Agents

Brandon Abdella
O: 337-233-1488
M: 337-257-7900
babdella@beaubox.com
O: 337-233-1488
M: 337-257-7900
babdella@beaubox.com
While we strive to provide the most accurate information, all listing information, and demographic data, is provided by third-parties. As such, MyEListing will not be responsible for the accuracy of the information. It is strongly recommended that you verify all information with the listing agent, and any relevant agencies, prior to making any decisions.


