Industrial Properties
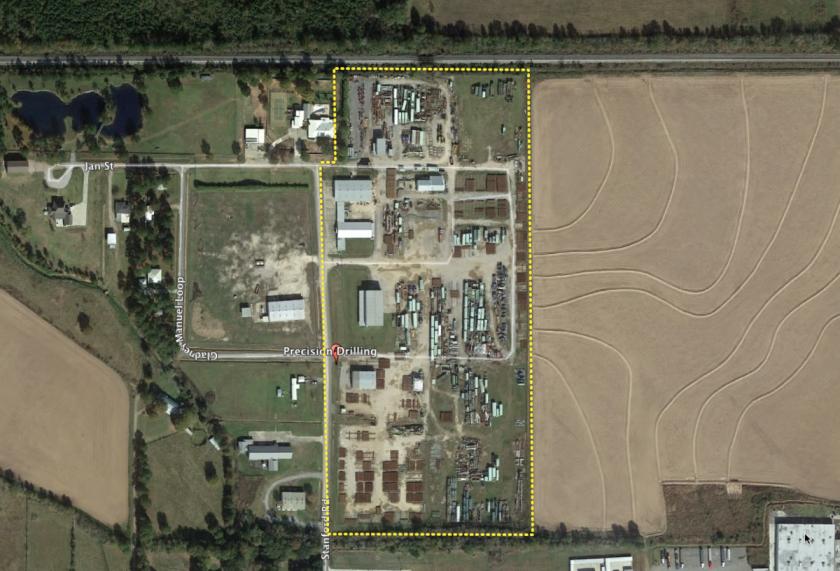
254 Stanford Rd Eunice, LA 70535
254 Stanford Rd Eunice, LA 70535
Details & Description
Property Highlights
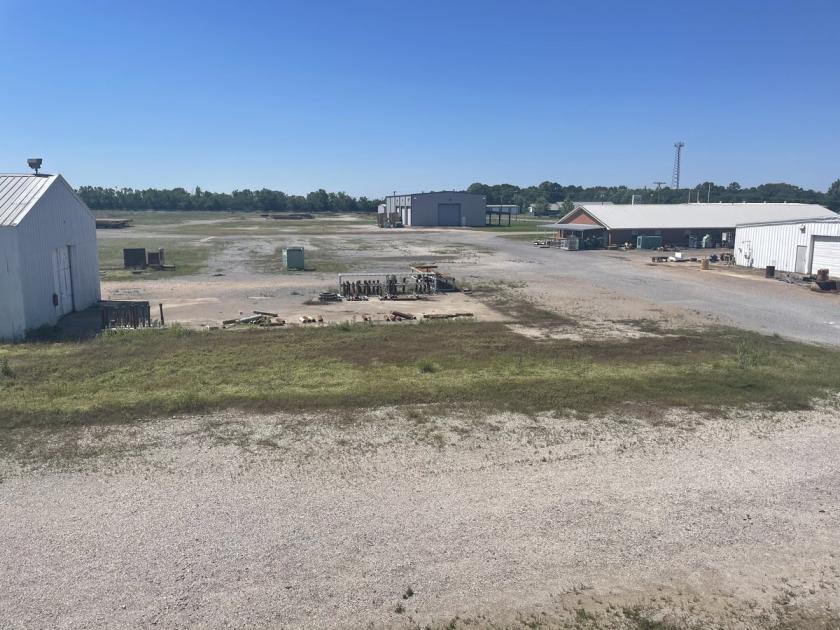
- • Site Size 28 acres stabilized yard
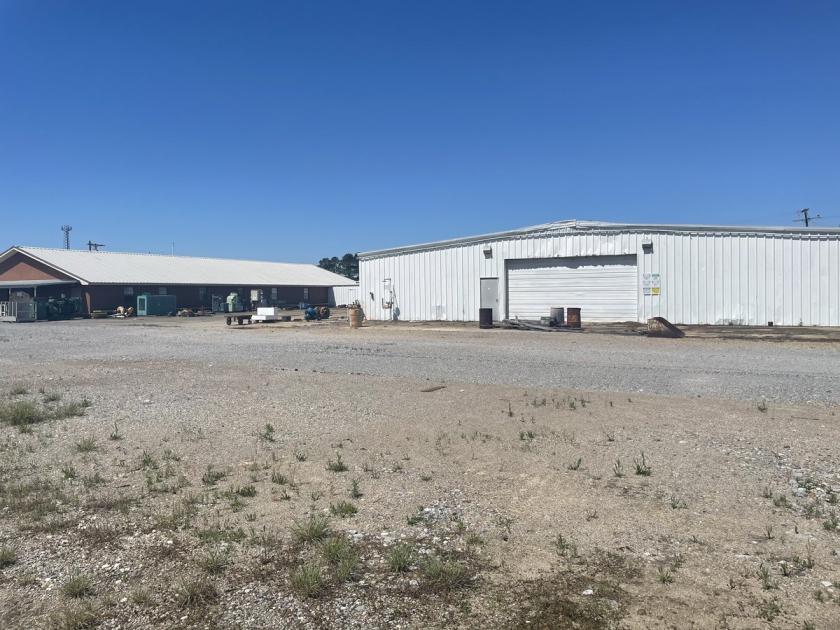
- • Total SF 37,300 SF
- • Eave Heights16 new warehouse and 14 old warehouse.
- • Lean-To 2,600 SF
- • Storage Building 4,210 SF
- • Welding Shop 4,940 SF
Additional Photos

Listing Agents

Brandon Abdella
O: 337-233-1488
M: 337-257-7900
babdella@beaubox.com
O: 337-233-1488
M: 337-257-7900
babdella@beaubox.com
While we strive to provide the most accurate information, all listing information, and demographic data, is provided by third-parties. As such, MyEListing will not be responsible for the accuracy of the information. It is strongly recommended that you verify all information with the listing agent, and any relevant agencies, prior to making any decisions.


