Specialty Real Estate
2683 Energy Drive Baton Rouge, LA 70808
2683 Energy Drive Baton Rouge, LA 70808
Details & Description
Property Highlights
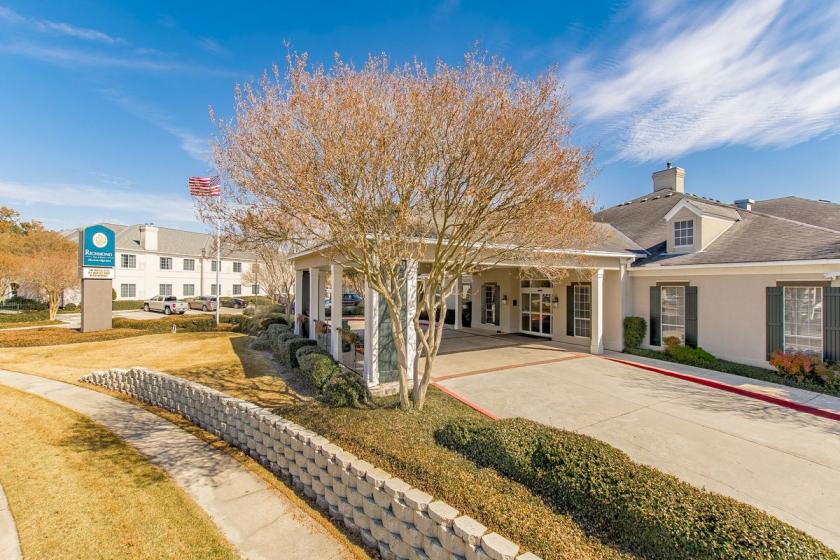
• Beautifully maintained 145-guestroom extended-stay hotel located just off Corporate Boulevard in Baton Rouge
• Running 12-month performance of $71.93 ADR, $32.59 RevPAR, and occupancy rate of 45
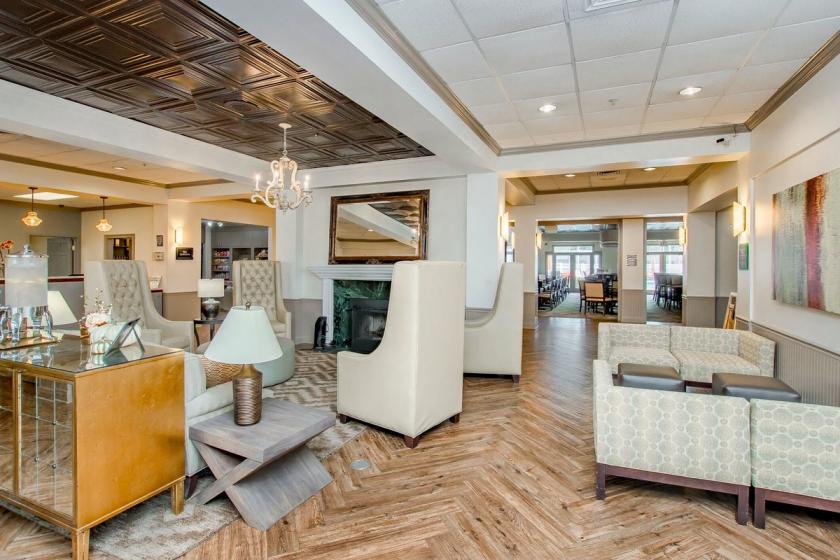
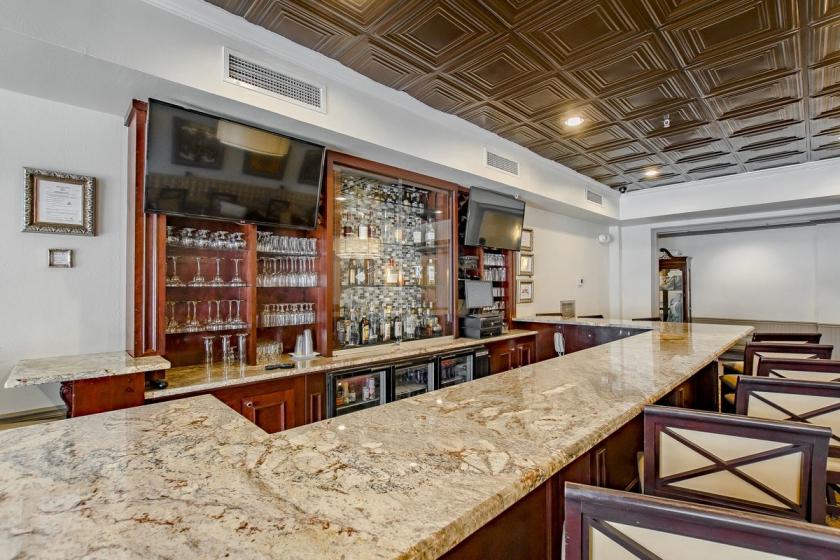
Additional Photos


Listing Agents

Bill Sanders
O: 225-237-3343
bsanders@beaubox.com
O: 225-237-3343
bsanders@beaubox.com
While we strive to provide the most accurate information, all listing information, and demographic data, is provided by third-parties. As such, MyEListing will not be responsible for the accuracy of the information. It is strongly recommended that you verify all information with the listing agent, and any relevant agencies, prior to making any decisions.


