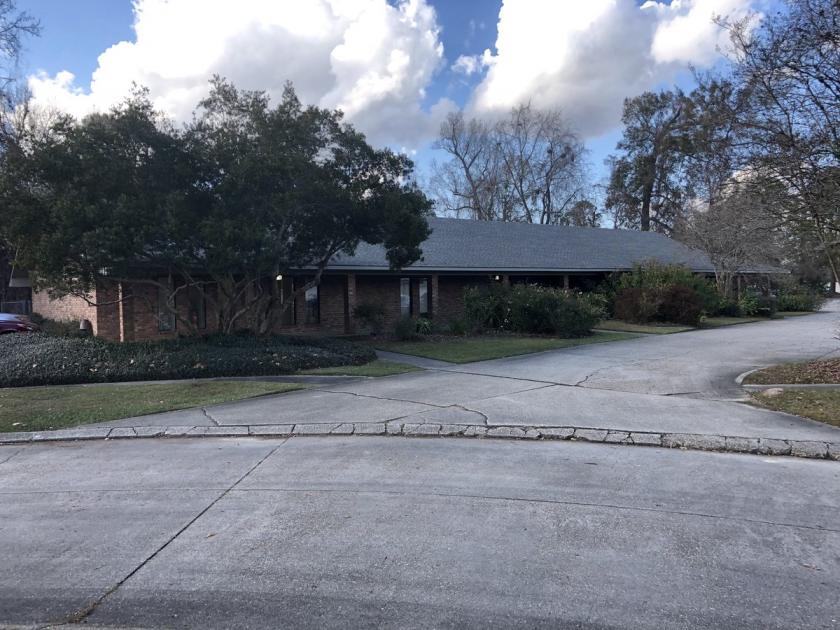
Office Space
604 Chevelle Court Baton Rouge, LA 70806
604 Chevelle Court Baton Rouge, LA 70806
Details & Description
Property Highlights
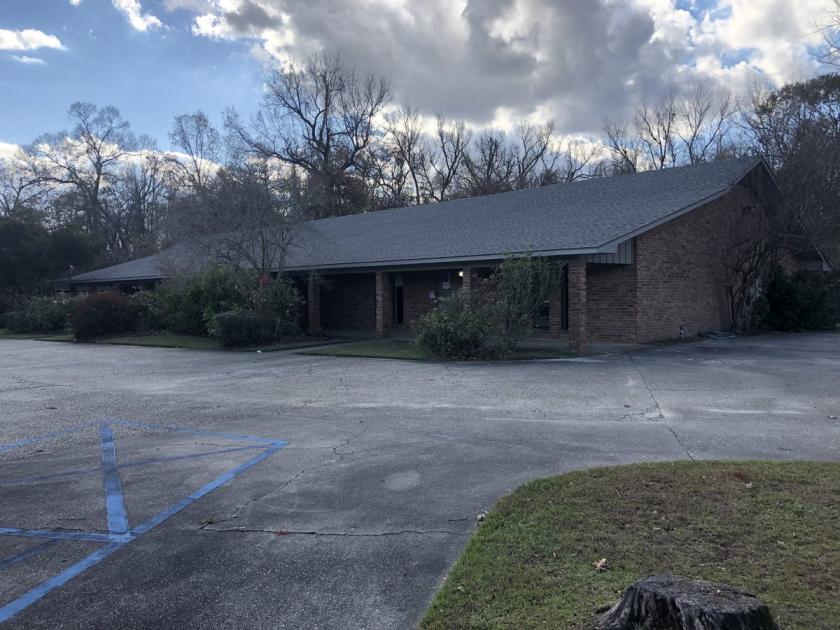
• Ample On-Site Surface Parking
• Zoned B1
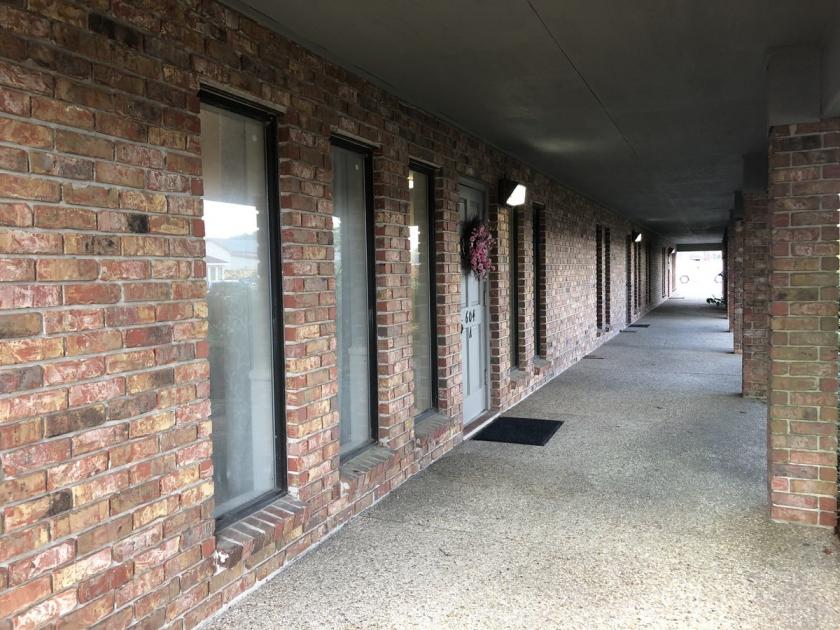
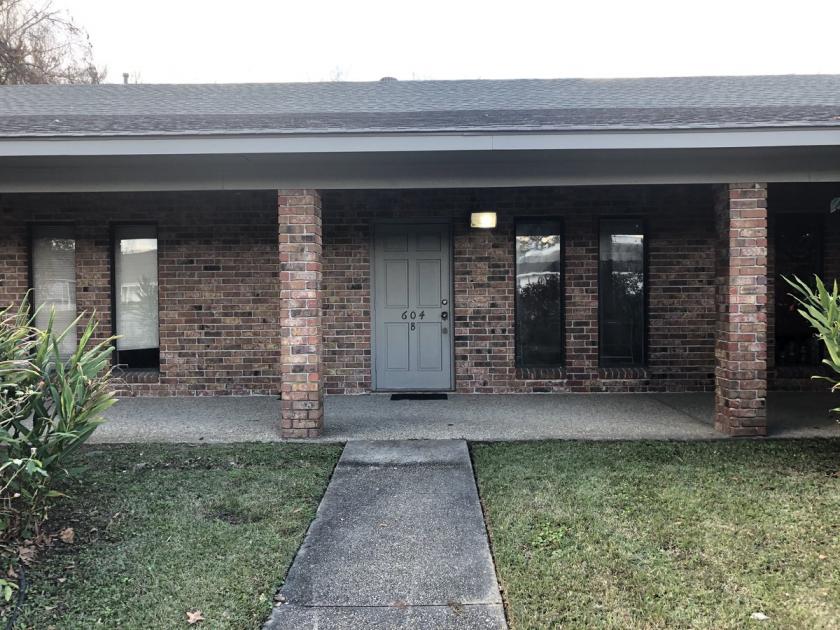
Additional Photos
Listing Agents

Reiss Weil
O: 225-237-3343
rweil@beaubox.com
O: 225-237-3343
rweil@beaubox.com
While we strive to provide the most accurate information, all listing information, and demographic data, is provided by third-parties. As such, MyEListing will not be responsible for the accuracy of the information. It is strongly recommended that you verify all information with the listing agent, and any relevant agencies, prior to making any decisions.


