Retail Space
5055 Veterans Memorial Boulevard Metairie, LA 70002
5055 Veterans Memorial Boulevard Metairie, LA 70002
Details & Description
Property Highlights
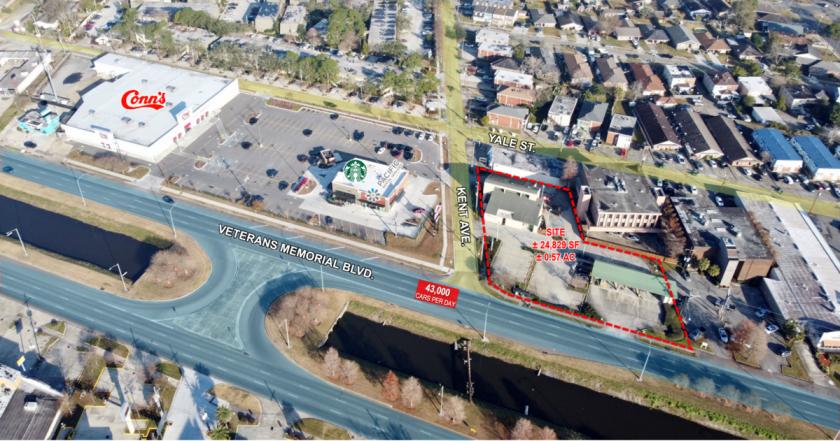
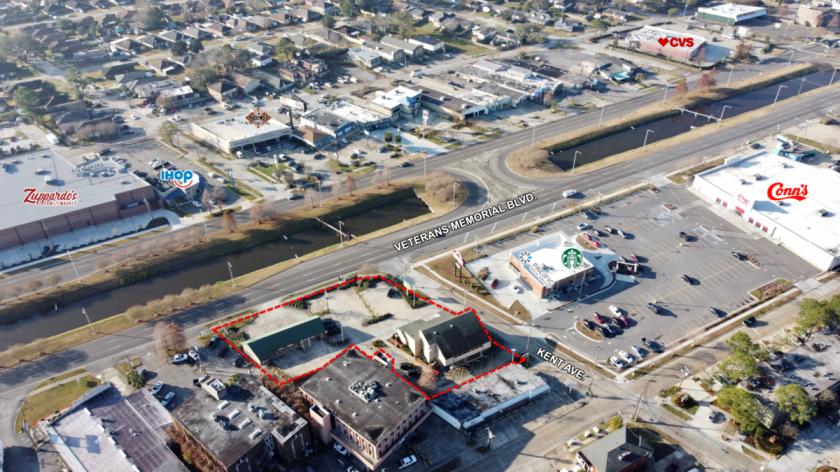
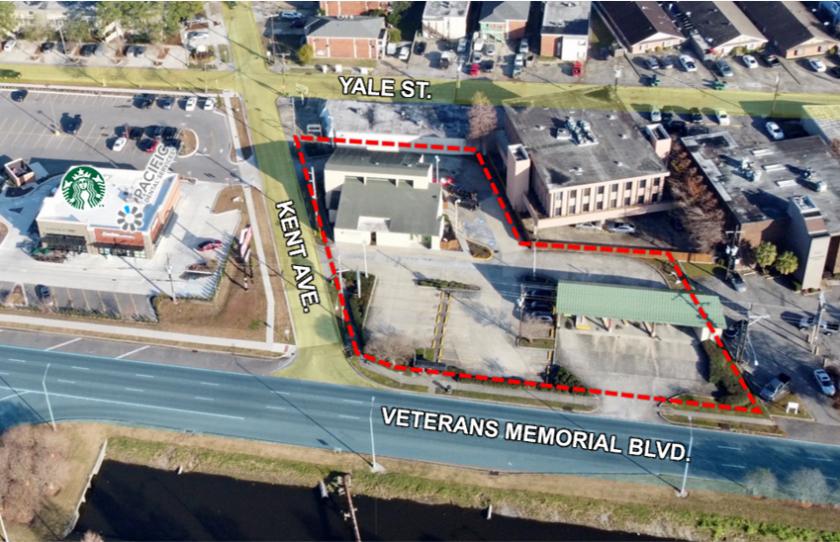
• Several new developments in the area including Conns HomePlus, Starbucks, Pacific Dental, Zuppardos Family Market
• High-profile location at the corner of Veterans Blvd Kent Ave.
Listing Agents

Matt Pittman
O: 225-237-3343
mpittman@beaubox.com
O: 225-237-3343
mpittman@beaubox.com
While we strive to provide the most accurate information, all listing information, and demographic data, is provided by third-parties. As such, MyEListing will not be responsible for the accuracy of the information. It is strongly recommended that you verify all information with the listing agent, and any relevant agencies, prior to making any decisions.