Multifamily Housing
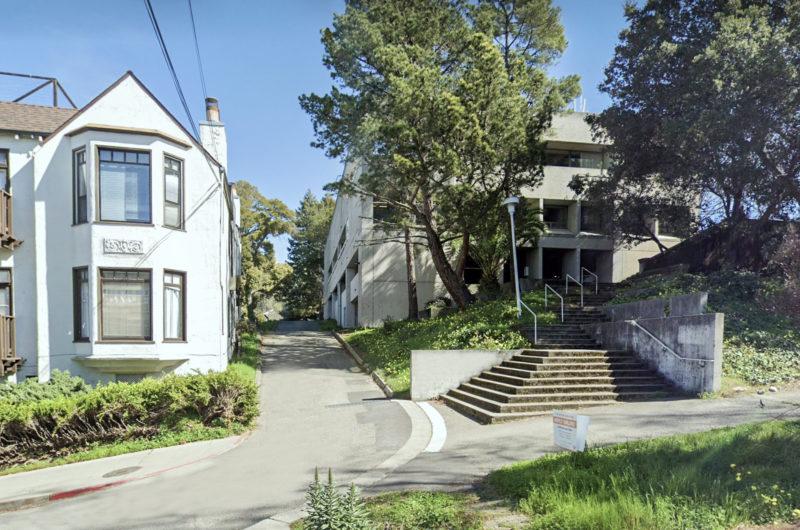
1729 Arch Street Berkeley, CA 94709
1729 Arch Street Berkeley, CA 94709
Details & Description
Property Highlights
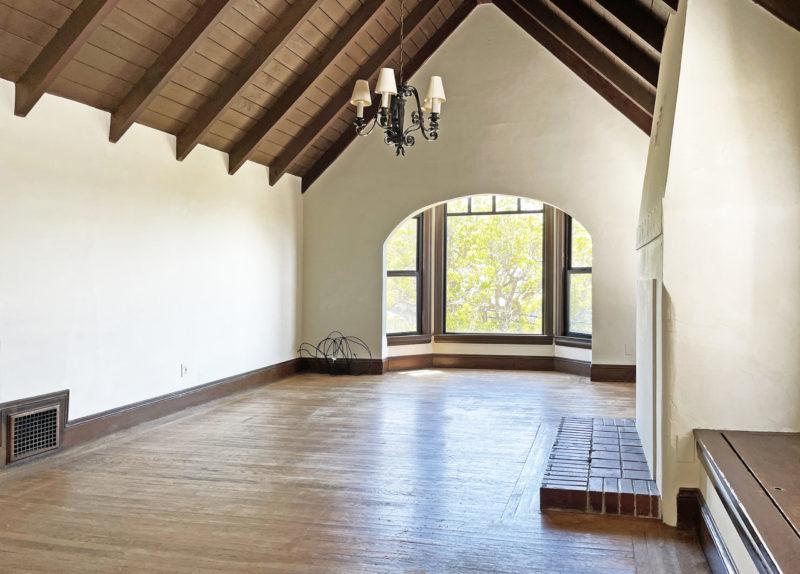
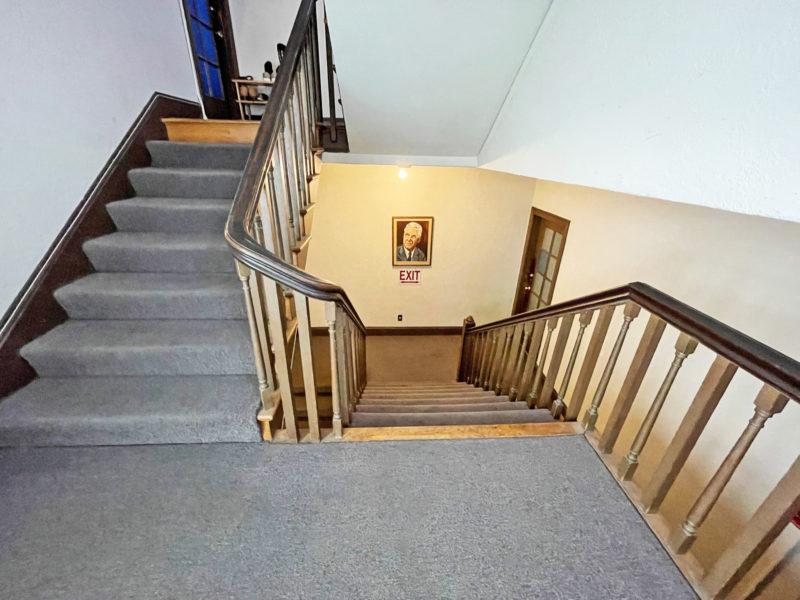
- • Graciously designed 6-unit residential building
- • Rear parking
- • Rooftop deck
Listing Agents

Kevin Gordon
O: 510-898-0513
kevin@gordoncommercial.com
O: 510-898-0513
kevin@gordoncommercial.com

Lori Rosenthal
Gordon CRE Brokerage
O: 510-524-2344
lori@gordoncommercial.com
Gordon CRE Brokerage
O: 510-524-2344
lori@gordoncommercial.com
While we strive to provide the most accurate information, all listing information, and demographic data, is provided by third-parties. As such, MyEListing will not be responsible for the accuracy of the information. It is strongly recommended that you verify all information with the listing agent, and any relevant agencies, prior to making any decisions.