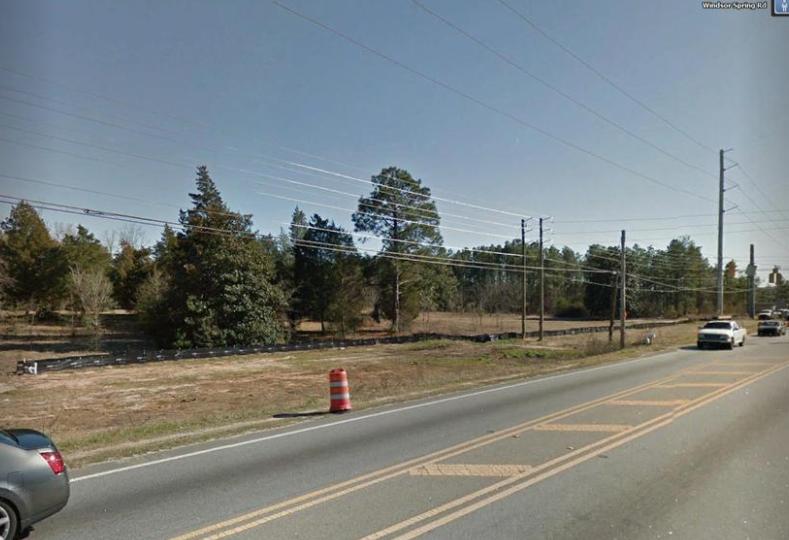
1-Mile | 3-Miles | 5-Miles | ||
---|---|---|---|---|
Total Population | 5,224 | 43,459 | 81,697 | |
Population Median Age | 39 | 37 | 36 | |
Population by Age | 0-9 Yrs | 690 (13%) | 5565 (12%) | 11399 (13%) |
10-19 Yrs | 594 (11%) | 6341 (14%) | 11910 (14%) | |
20-29 Yrs | 754 (14%) | 6488 (14%) | 12243 (14%) | |
30-39 Yrs | 589 (11%) | 6006 (13%) | 11140 (13%) | |
40-49 Yrs | 583 (11%) | 4912 (11%) | 8885 (10%) | |
50-59 Yrs | 846 (16%) | 6115 (14%) | 10602 (12%) | |
60-69 Yrs | 690 (13%) | 4854 (11%) | 9068 (11%) | |
70+ Yrs | 477 (9%) | 3179 (7%) | 6450 (7%) | |
Median HH Income | $44,348 | $48,353 | $43,334 | |
Total Household Income | < 24K | 338 (19%) | 3424 (24%) | 7410 (27%) |
25-49K | 624 (35%) | 3796 (26%) | 7453 (28%) | |
50-74K | 382 (21%) | 3265 (23%) | 5582 (20%) | |
75-99K | 123 (7%) | 1637 (11%) | 2963 (11%) | |
100-199K | 287 (16%) | 1849 (13%) | 2967 (11%) | |
200K+ | 3 (0%) | 92 (0%) | 221 (0%) | |
Highest Education Level | No Diploma | 542 | 4049 | 8792 |
Diploma or GED | 1050 | 9278 | 18368 | |
Some College | 915 | 6870 | 12337 | |
Assoc. Degree | 587 | 3070 | 4934 | |
Bachelors Degree | 388 | 3243 | 5262 | |
Higher Degree | 130 | 1672 | 2722 | |
Total Housing Units | 2,108 | 15,920 | 30,890 | |
--Owner-Occupied | 1,150 | 8,677 | 15,210 | |
--Renter-Occupied | 608 | 5,385 | 11,387 | |
Owner-Occupied Values | < 100K | 577 | 4526 | 8776 |
100-199K | 409 | 3225 | 5075 | |
200-299K | 127 | 638 | 939 | |
300-399K | 36 | 166 | 233 | |
400-499K | 0 | 9 | 29 | |
500K+ | 0 | 112 | 157 | |
Total Working Age Population | 4,147 | 34,015 | 63,315 | |
In Work Force | 2,321 | 20,732 | 37,195 | |
Not In Work Force | 1,826 | 13,283 | 26,120 | |
Workforce Employed | 2,103 | 18,553 | 32,804 | |
Workforce Unemployed | 181 | 1,933 | 3,417 | |
Civlian Workforce | 2,283 | 20,486 | 36,221 | |
Military Workforce | 37 | 246 | 974 | |
Total Households | 1,757 | 14,062 | 26,596 | |
Family Households | 1,271 | 10,020 | 18,482 | |
Non-Family Households | 487 | 4,042 | 8,114 | |
Married Couple | 782 | 5,407 | 9,897 | |
Other Family | 489 | 4,613 | 8,585 | |
Married w/Child | 288 | 1,710 | 3,123 | |
Single Male w/Child | 40 | 299 | 554 | |
Single Female w/Child | 166 | 2,063 | 4,028 |
Population Change Last Two Decades - Plus Projection
2000 | % | 2010 | % | 2020 | % | 2030 | |
---|---|---|---|---|---|---|---|
Georgia | 8,186,453 | +18 | 9,687,653 | +12 | 10,833,472 | +13 | 12,292,423 |
Columbia County | 89,288 | +39 | 124,053 | +28 | 158,631 | +12 | 177,910 |
Richmond County | 199,775 | 0 | 200,549 | +1 | 202,240 | +1 | 204,904 |
South Carolina | 4,012,012 | +15 | 4,625,364 | +9 | 5,020,400 | +9 | 5,488,460 |
Aiken County | 142,552 | +12 | 160,099 | +11 | 177,510 | +11 | 196,500 |
Total Working Age Population:
Total Households:
Total Working Age Population:
Total Households:
Total Working Age Population:
Total Households: