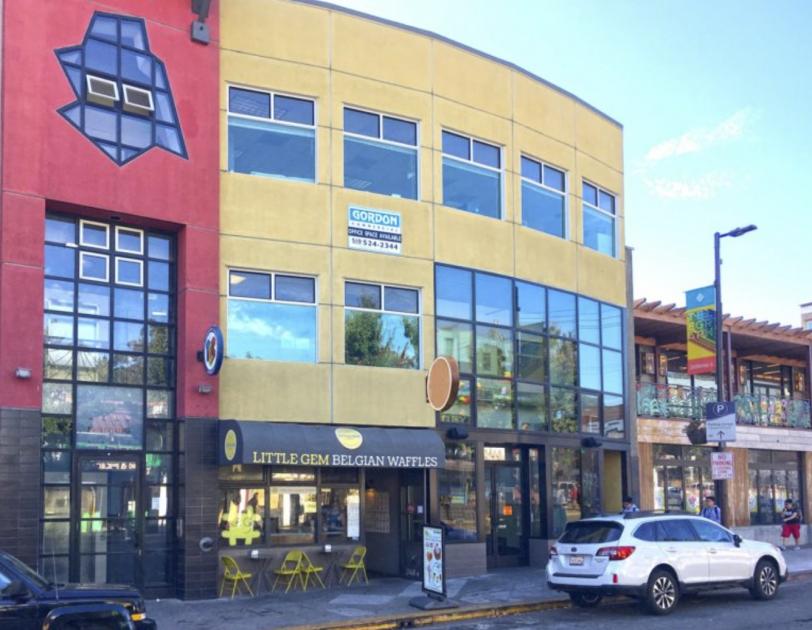
Office Space
2470 Telegraph Avenue Berkeley, CA 94704
2470 Telegraph Avenue Berkeley, CA 94704
Details & Description
Property Highlights
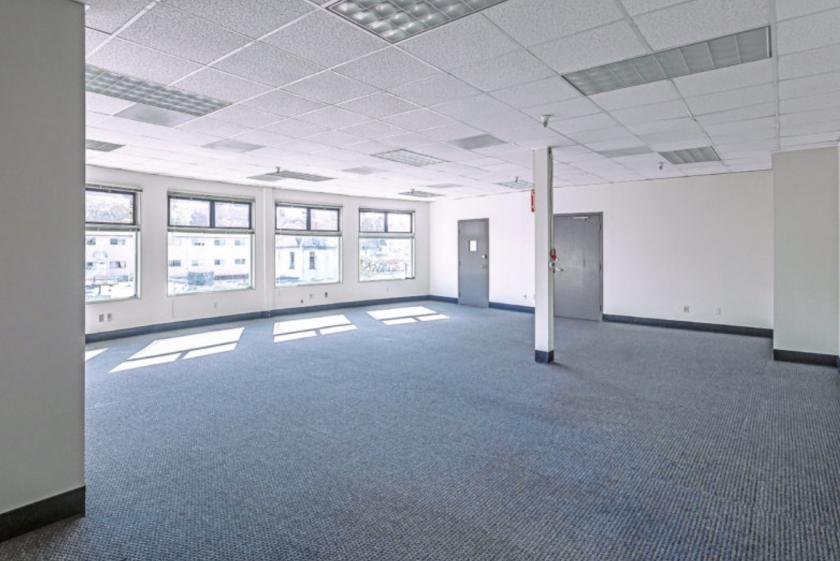
- • Mix of open space with private offices
- • New flooring and paint throughout
- • Elevator, HVAC, and ADA restrooms in place
- • Building meets UC seismic requirements
- • Secure entrance with key pad entry to lobby
Listing Agents

Kevin Gordon
O: 510-898-0513
kevin@gordoncommercial.com
O: 510-898-0513
kevin@gordoncommercial.com
While we strive to provide the most accurate information, all listing information, and demographic data, is provided by third-parties. As such, MyEListing will not be responsible for the accuracy of the information. It is strongly recommended that you verify all information with the listing agent, and any relevant agencies, prior to making any decisions.