Industrial Properties
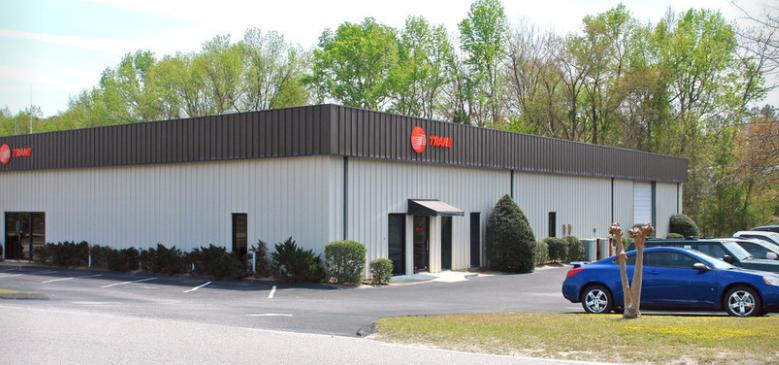
3342 Commerce Drive Augusta, GA 30909
3342 Commerce Drive Augusta, GA 30909
Details & Description
Property Highlights
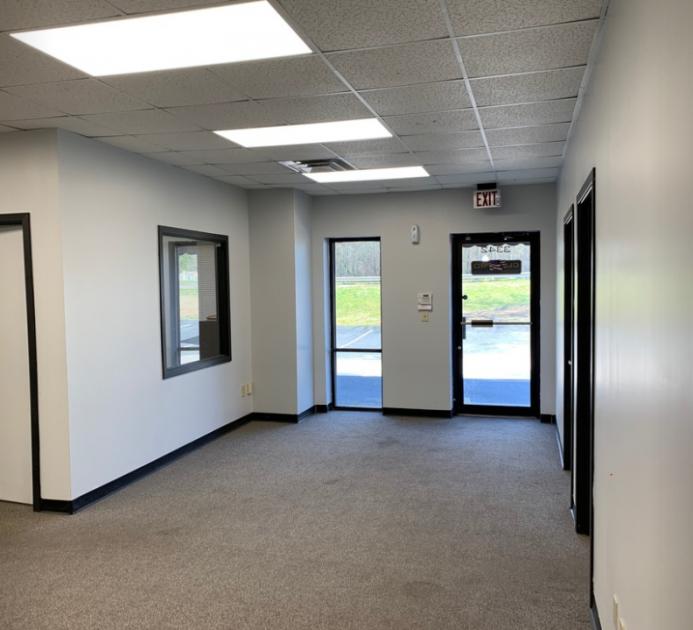
- • Large Counter and Showroom Area
- • Less than 1 mile from Bobby Jones Expressway
- • Large Parking Lot
Additional Photos


Listing Agents

Scott A. Atkins
O: 706-951-6630
M: 706-650-1446
scott@atkinsrealty.com
O: 706-951-6630
M: 706-650-1446
scott@atkinsrealty.com
While we strive to provide the most accurate information, all listing information, and demographic data, is provided by third-parties. As such, MyEListing will not be responsible for the accuracy of the information. It is strongly recommended that you verify all information with the listing agent, and any relevant agencies, prior to making any decisions.


