Industrial Properties
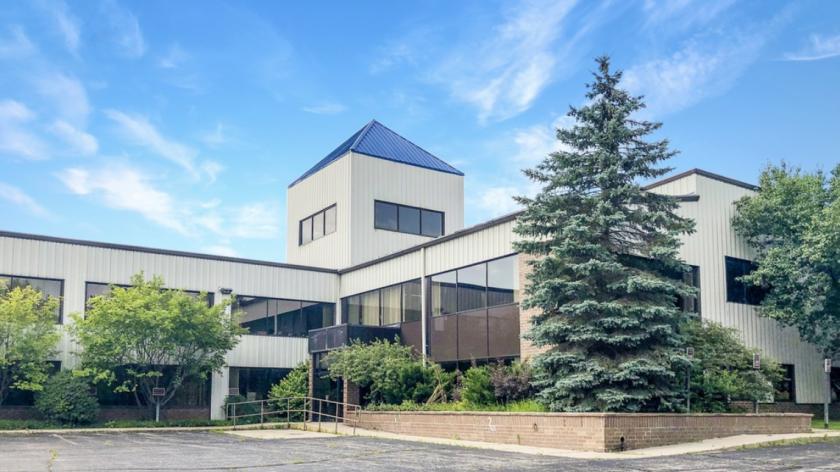
7300 West Joy Road Dexter, MI 48130
7300 West Joy Road Dexter, MI 48130
Details & Description
Property Highlights
• Several floor drains and watersink areas, storage shed and chemical storage cages in rear of building
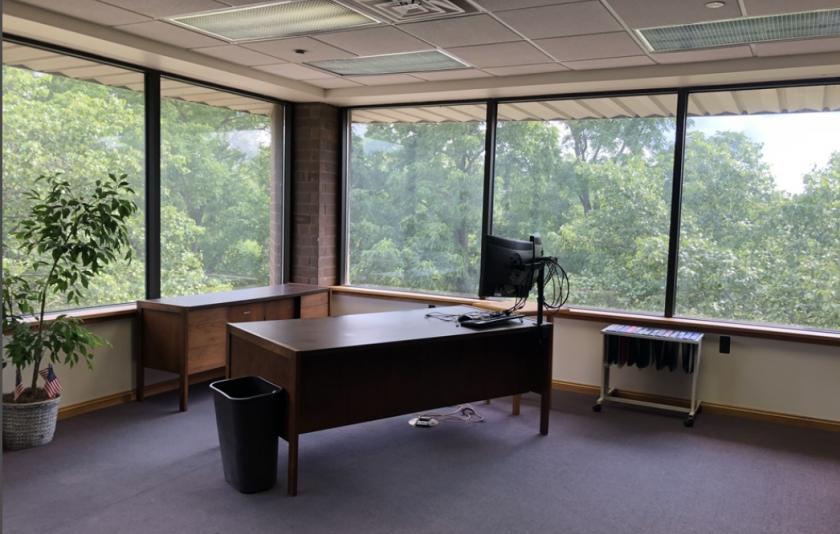
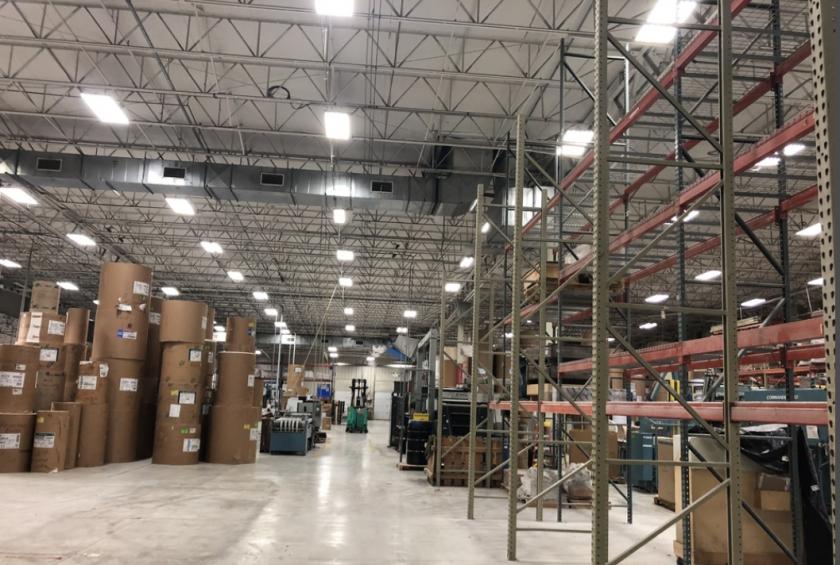
• Approx. 107,000 sf of fully air conditioned manufacturing warehouse space
Listing Agents

Michael Jurgenson
Swisher Commercial
O: 734-222-7522
mikej@swishercommercial.com
Swisher Commercial
O: 734-222-7522
mikej@swishercommercial.com
While we strive to provide the most accurate information, all listing information, and demographic data, is provided by third-parties. As such, MyEListing will not be responsible for the accuracy of the information. It is strongly recommended that you verify all information with the listing agent, and any relevant agencies, prior to making any decisions.