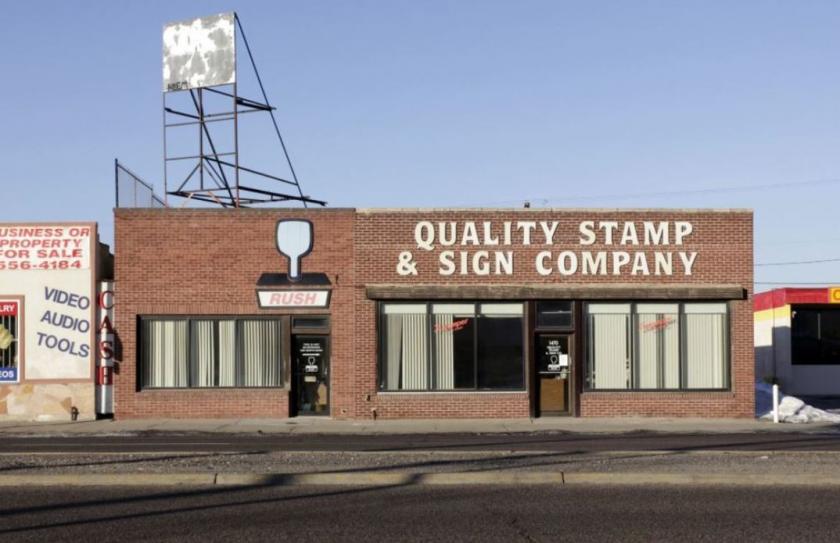
1-Mile | 3-Miles | 5-Miles | ||
---|---|---|---|---|
Total Population | 17,497 | 155,128 | 316,481 | |
Population Median Age | 36 | 35 | 35 | |
Population by Age | 0-9 Yrs | 2255 (12%) | 17669 (11%) | 41260 (13%) |
10-19 Yrs | 1631 (9%) | 15547 (10%) | 35894 (11%) | |
20-29 Yrs | 3306 (18%) | 37295 (24%) | 66423 (20%) | |
30-39 Yrs | 3550 (20%) | 28824 (18%) | 53919 (17%) | |
40-49 Yrs | 2056 (11%) | 17599 (11%) | 37592 (11%) | |
50-59 Yrs | 1883 (10%) | 14558 (9%) | 31100 (9%) | |
60-69 Yrs | 1691 (9%) | 13581 (8%) | 27127 (8%) | |
70+ Yrs | 1127 (6%) | 10055 (6%) | 23166 (7%) | |
Median HH Income | $51,059 | $55,899 | $58,147 | |
Total Household Income | < 24K | 2266 (28%) | 14843 (22%) | 24306 (19%) |
25-49K | 1600 (20%) | 15043 (22%) | 29129 (23%) | |
50-74K | 1397 (17%) | 11945 (18%) | 23545 (18%) | |
75-99K | 1138 (14%) | 8242 (12%) | 16213 (13%) | |
100-199K | 1260 (16%) | 11804 (17%) | 23164 (18%) | |
200K+ | 195 (2%) | 3958 (6%) | 7869 (6%) | |
Highest Education Level | No Diploma | 1708 | 12080 | 24290 |
Diploma or GED | 2829 | 18836 | 42197 | |
Some College | 3141 | 20092 | 42343 | |
Assoc. Degree | 707 | 7413 | 15195 | |
Bachelors Degree | 2455 | 26310 | 50490 | |
Higher Degree | 1575 | 20235 | 35404 | |
Total Housing Units | 8,314 | 71,691 | 134,046 | |
--Owner-Occupied | 3,237 | 27,960 | 59,480 | |
--Renter-Occupied | 4,618 | 37,874 | 64,746 | |
Owner-Occupied Values | < 100K | 60 | 863 | 4068 |
100-199K | 766 | 6267 | 12643 | |
200-299K | 1435 | 7448 | 14918 | |
300-399K | 712 | 5502 | 10767 | |
400-499K | 131 | 3480 | 6666 | |
500K+ | 132 | 4399 | 10418 | |
Total Working Age Population | 14,069 | 128,484 | 254,721 | |
In Work Force | 10,372 | 93,719 | 182,911 | |
Not In Work Force | 3,697 | 34,765 | 71,810 | |
Workforce Employed | 10,015 | 90,488 | 175,852 | |
Workforce Unemployed | 347 | 3,151 | 6,914 | |
Civlian Workforce | 10,362 | 93,639 | 182,766 | |
Military Workforce | 10 | 80 | 145 | |
Total Households | 7,855 | 65,834 | 124,226 | |
Family Households | 3,454 | 30,446 | 67,017 | |
Non-Family Households | 4,402 | 35,389 | 57,209 | |
Married Couple | 2,285 | 21,914 | 48,163 | |
Other Family | 1,169 | 8,531 | 18,854 | |
Married w/Child | 979 | 8,845 | 20,959 | |
Single Male w/Child | 139 | 1,321 | 2,952 | |
Single Female w/Child | 542 | 2,841 | 6,624 |
Population Change Last Two Decades - Plus Projection
2000 | % | 2010 | % | 2020 | % | 2030 | |
---|---|---|---|---|---|---|---|
Utah | 2,233,169 | +24 | 2,763,885 | +20 | 3,325,425 | +17 | 3,889,310 |
Davis County | 238,994 | +28 | 306,479 | +19 | 364,813 | +11 | 406,046 |
Morgan County | 7,129 | +33 | 9,469 | +42 | 13,443 | +31 | 17,612 |
Salt Lake County | 898,387 | +15 | 1,029,655 | +15 | 1,181,471 | +11 | 1,306,414 |
Total Working Age Population:
Total Households:
Total Working Age Population:
Total Households:
Total Working Age Population:
Total Households: