Office Space
1050 South State Street Salt Lake City, UT 84111
1050 South State Street Salt Lake City, UT 84111

Details & Description
Property Highlights
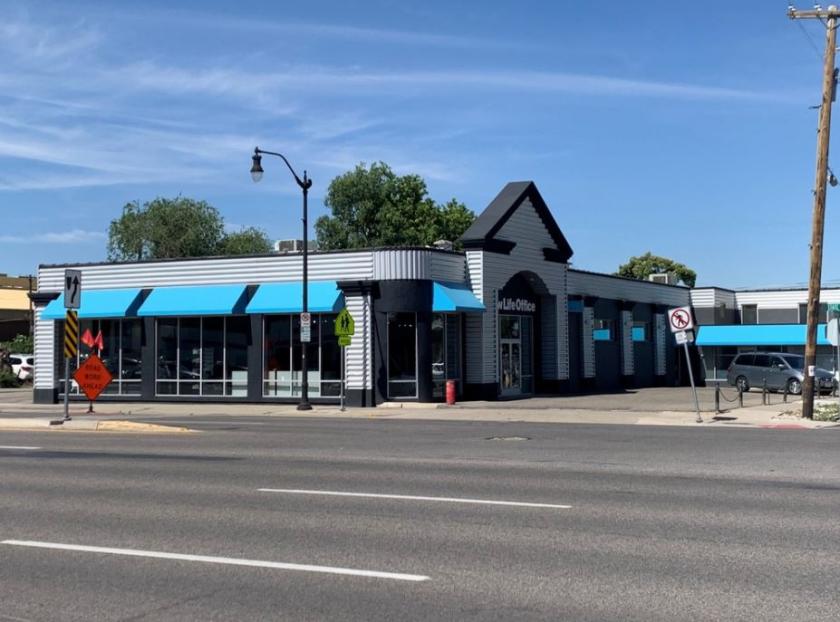
- • Freestanding Retail Office Building
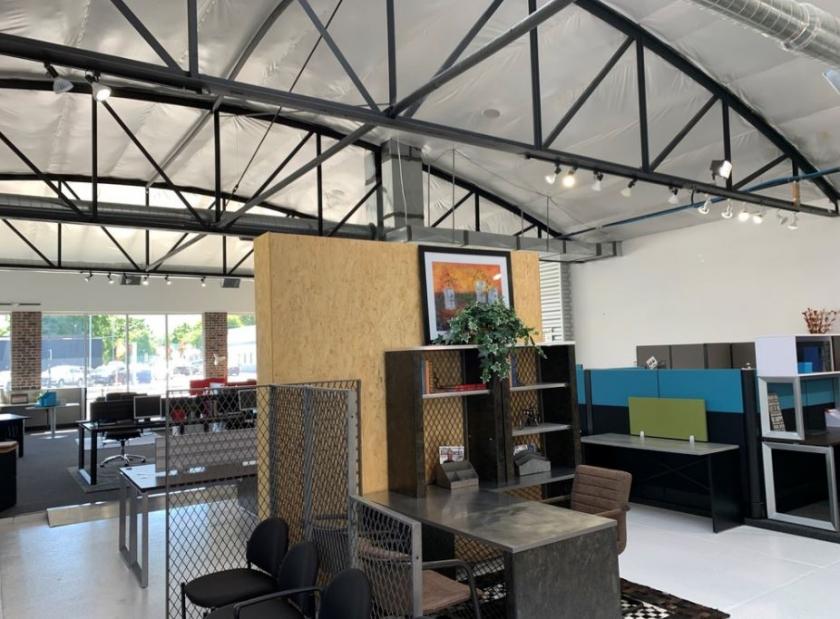
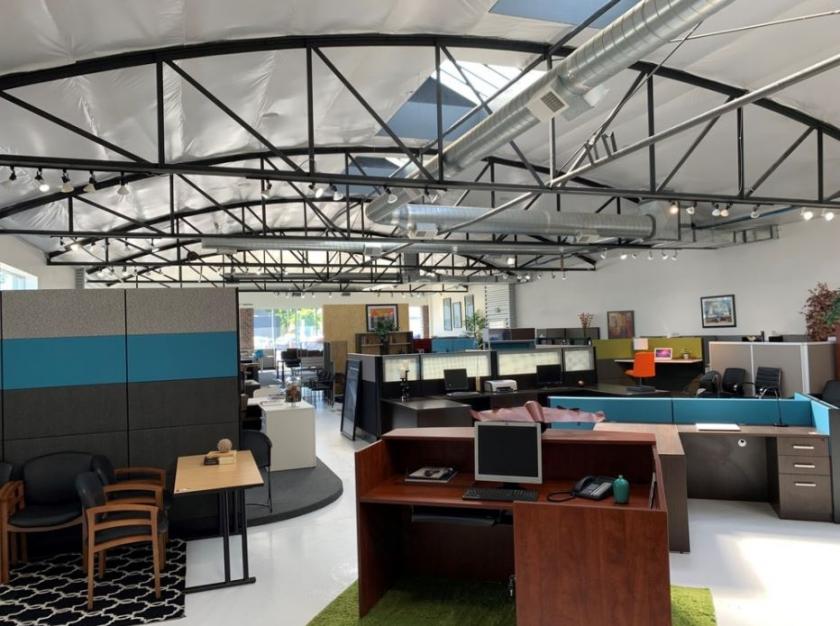
- • Completely Remodeled with Open Floor Plan Design
- • Excellent State Street Location
- • Highly Visible Building with Great Signage
- • Easy Freeway Access
- • 20 On-Site Parking Stalls
Additional Photos

Listing Agents

John Gurr
O: 801-355-0600
john@iproperties.com
O: 801-355-0600
john@iproperties.com
While we strive to provide the most accurate information, all listing information, and demographic data, is provided by third-parties. As such, MyEListing will not be responsible for the accuracy of the information. It is strongly recommended that you verify all information with the listing agent, and any relevant agencies, prior to making any decisions.


