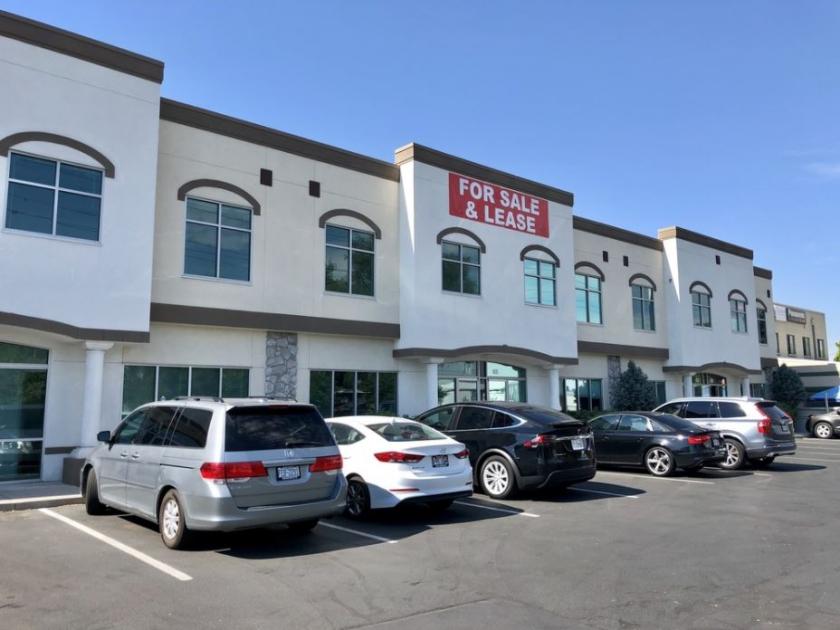
Office Space
62 2700 S Salt Lake City, UT 84115
62 2700 S Salt Lake City, UT 84115
Details & Description
Property Highlights
- • Well Kept OfficeRetail Condos
- • Priced Aggressively Below Market
- • Great Visibility from State Street
- • Lots of Parking
- • Nearby Freeway Access
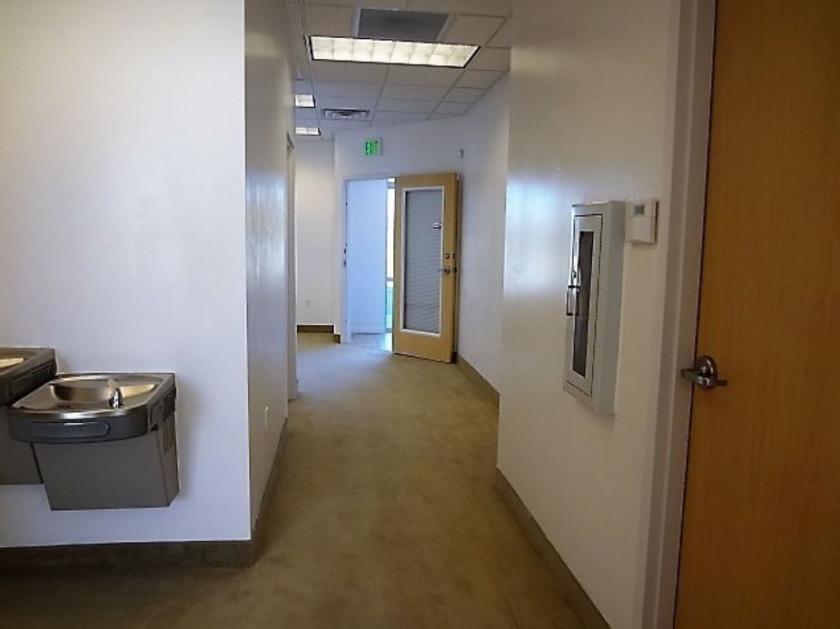
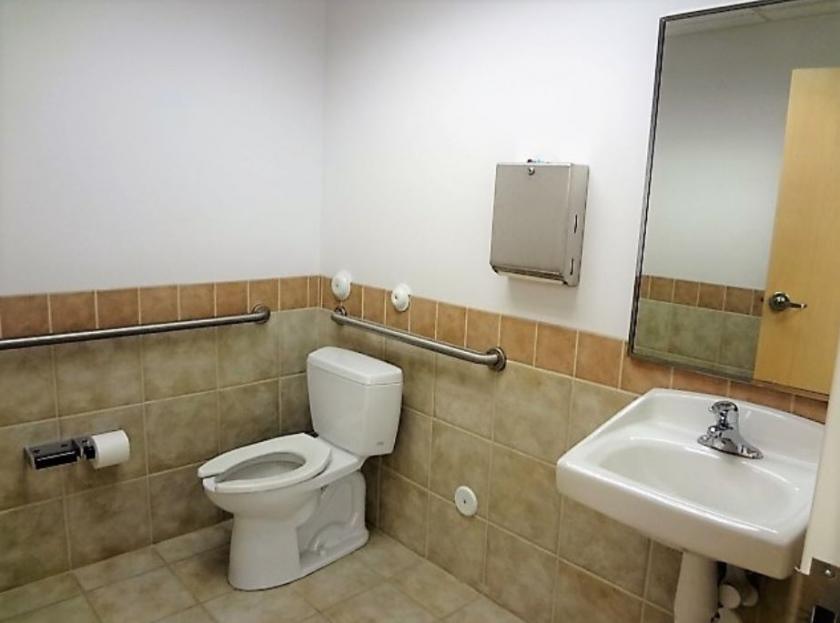
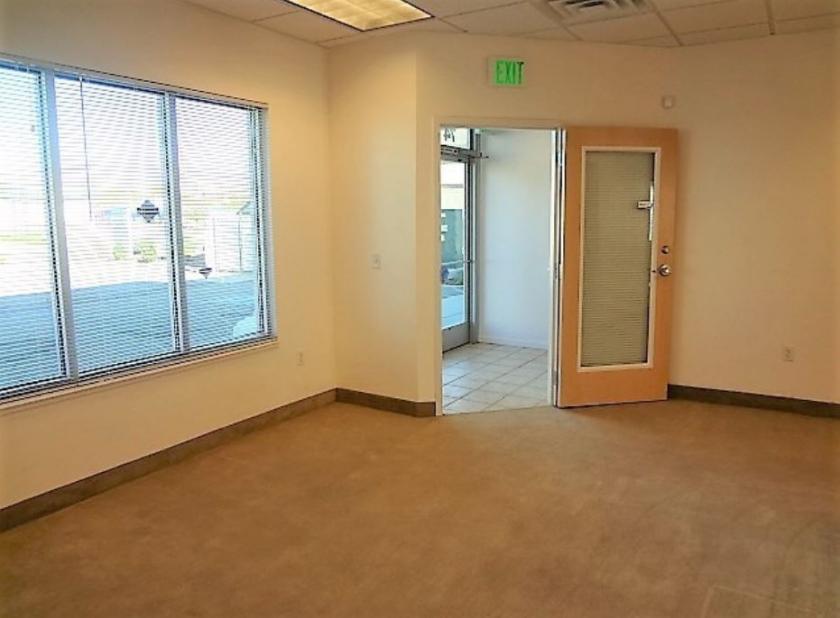
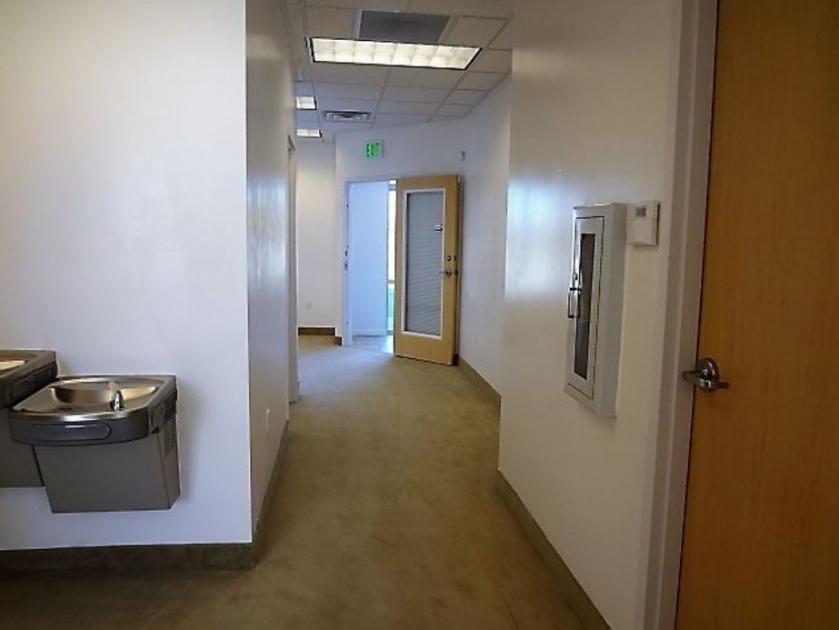
Additional Photos
Listing Agents

Chris Metos
O: 801-879-7870
chris@iproperties.com
O: 801-879-7870
chris@iproperties.com
While we strive to provide the most accurate information, all listing information, and demographic data, is provided by third-parties. As such, MyEListing will not be responsible for the accuracy of the information. It is strongly recommended that you verify all information with the listing agent, and any relevant agencies, prior to making any decisions.


