Flex-Office-Warehouse
1020 Colmar Avenue Salt Lake City, UT 84104
1020 Colmar Avenue Salt Lake City, UT 84104

Details & Description
Property Highlights
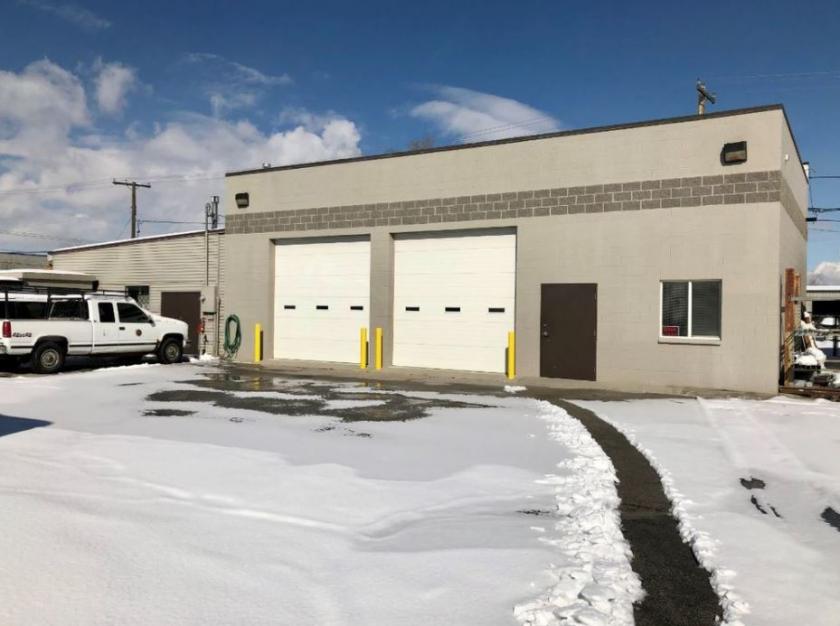
- • Office Warehouse Space
- • 1,600 SF Office with 2,400 SF Warehouse
- • 2 Two 12 Ground Level Doors
- • Ceiling Height Clearance 14
- • Rare Yard Space Included
- • Located Close to Downtown
Listing Agents

Eric Fuhrman
O: 801-355-0600
M: 801-859-2862
eric@iproperties.com
O: 801-355-0600
M: 801-859-2862
eric@iproperties.com
While we strive to provide the most accurate information, all listing information, and demographic data, is provided by third-parties. As such, MyEListing will not be responsible for the accuracy of the information. It is strongly recommended that you verify all information with the listing agent, and any relevant agencies, prior to making any decisions.