Office Space
105 Hartford Turnpike Shrewsbury, MA 01545
105 Hartford Turnpike Shrewsbury, MA 01545

Details & Description
Property Highlights
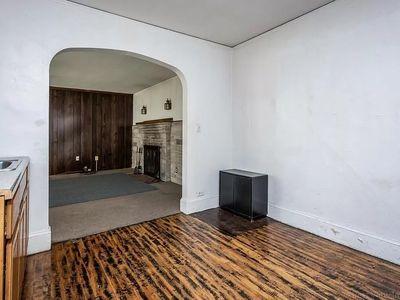
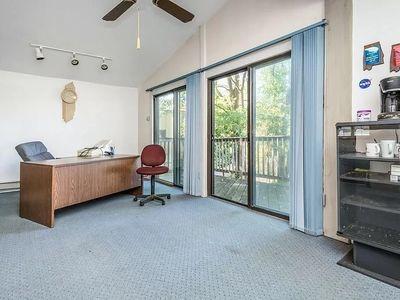
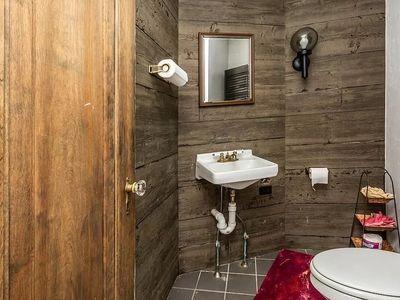
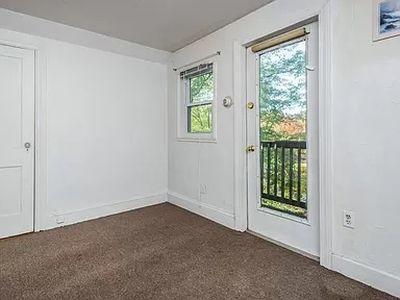
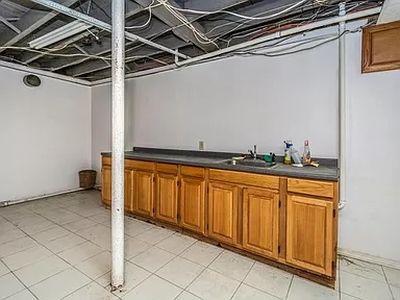
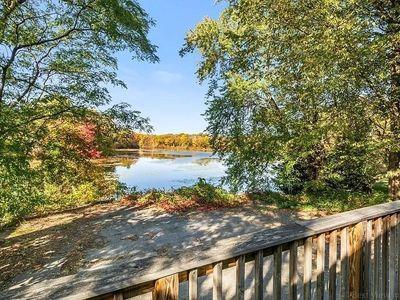
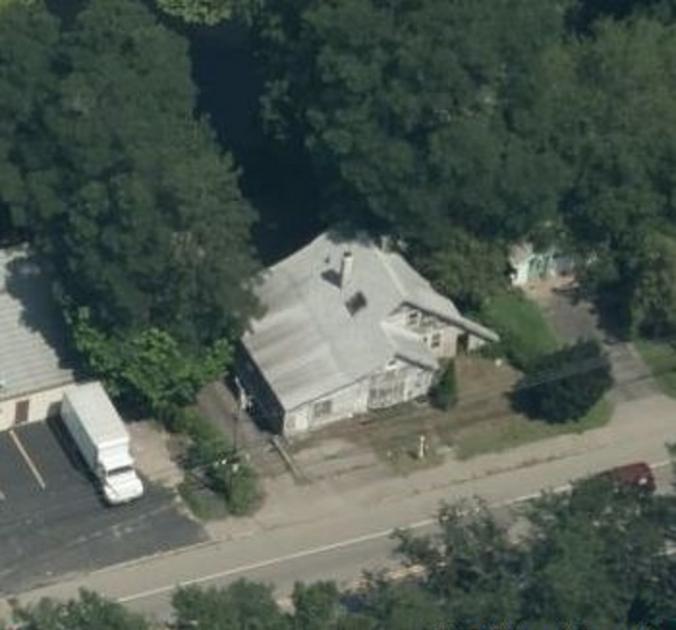
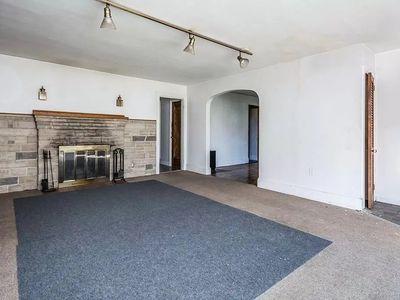
• Waterfront Commercial Office Property on the Lake Quinsigamond
• Waterfront Commercial Office Property on the Lake Quinsigamond
Additional Photos


Listing Agents

Sergei Krivoshlykov
O: 202-341-6093
altaircenter@aol.com
O: 202-341-6093
altaircenter@aol.com
While we strive to provide the most accurate information, all listing information, and demographic data, is provided by third-parties. As such, MyEListing will not be responsible for the accuracy of the information. It is strongly recommended that you verify all information with the listing agent, and any relevant agencies, prior to making any decisions.