Industrial Properties
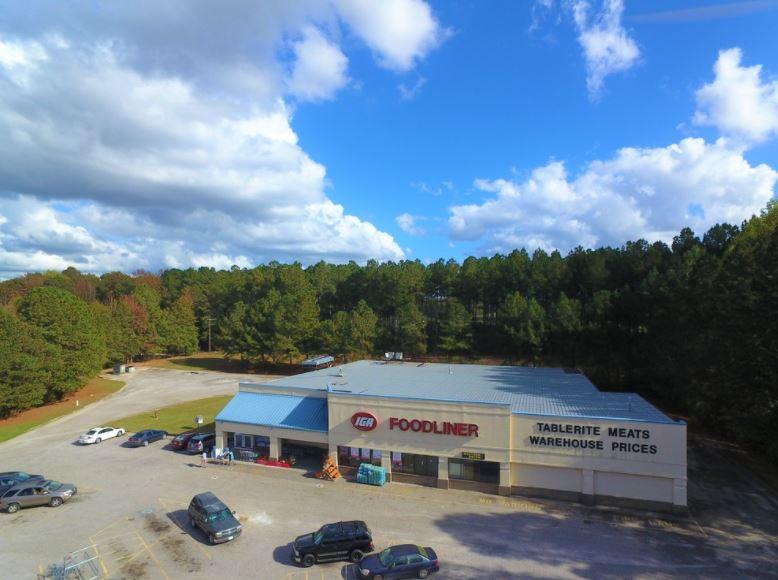
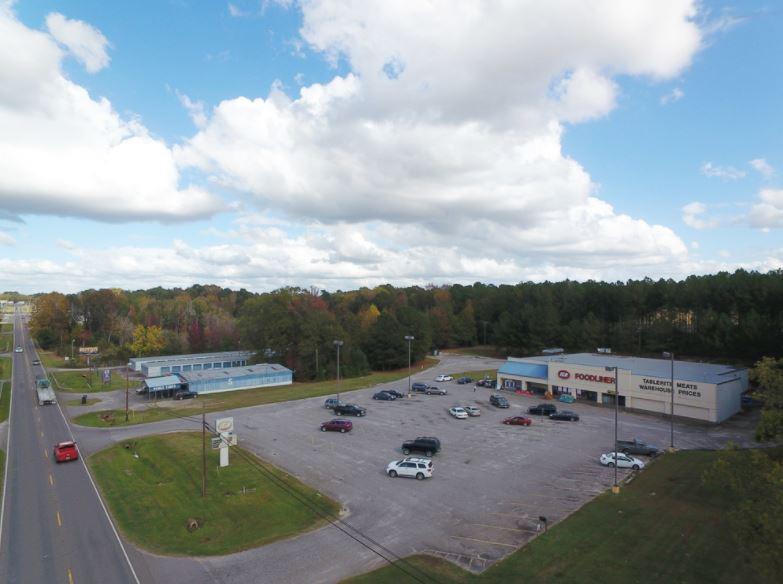
170 Lee Street Johnston, SC 29832
170 Lee Street Johnston, SC 29832
Details & Description
Property Highlights
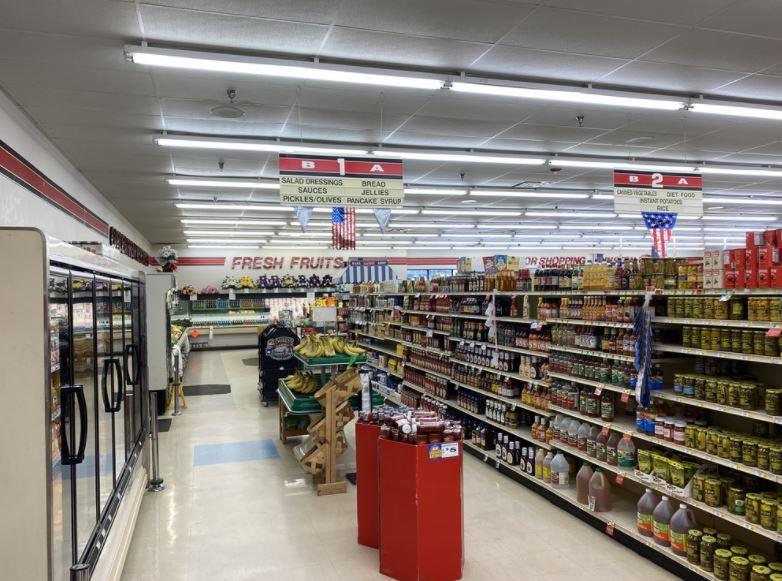
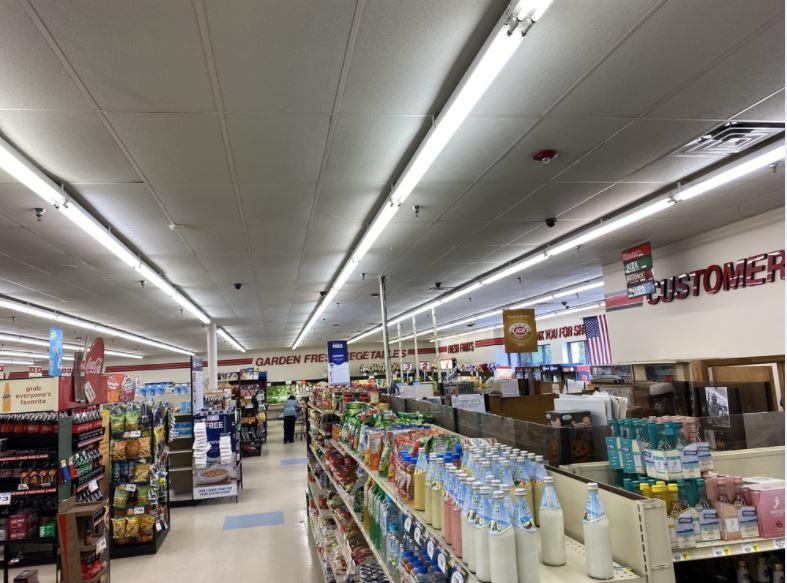
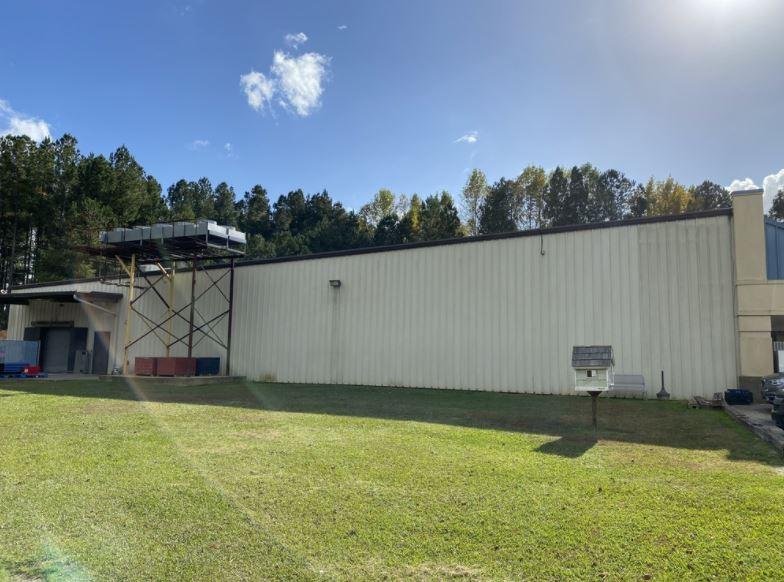
- • - 16,500 sf former supermarket
- • - 4.92 Acres
- • Abundant parking
- • Deed Restriction in place preventing grocery use
- • Zoning BD-2 Town of Johnston
Additional Photos
Listing Agents

Ryan Causey
O: 803-744-9836
rcausey@trinity-partners.com
O: 803-744-9836
rcausey@trinity-partners.com

Alex Johnson
NAI Columbia
O: 803-744-9827
ajohnson@naicolumbia.com
NAI Columbia
O: 803-744-9827
ajohnson@naicolumbia.com

Peyton Bryant
O: 803-744-9876
pbryant@trinity-partners.com
O: 803-744-9876
pbryant@trinity-partners.com
While we strive to provide the most accurate information, all listing information, and demographic data, is provided by third-parties. As such, MyEListing will not be responsible for the accuracy of the information. It is strongly recommended that you verify all information with the listing agent, and any relevant agencies, prior to making any decisions.


