Office Space
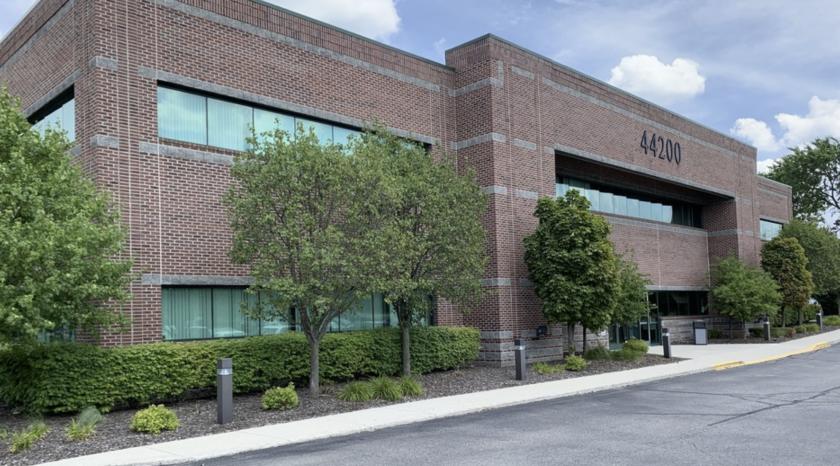
44200 Woodward Avenue Pontiac, MI 48341
44200 Woodward Avenue Pontiac, MI 48341
Details & Description
Property Highlights
- • Located on highly-traveled Woodward Avenue
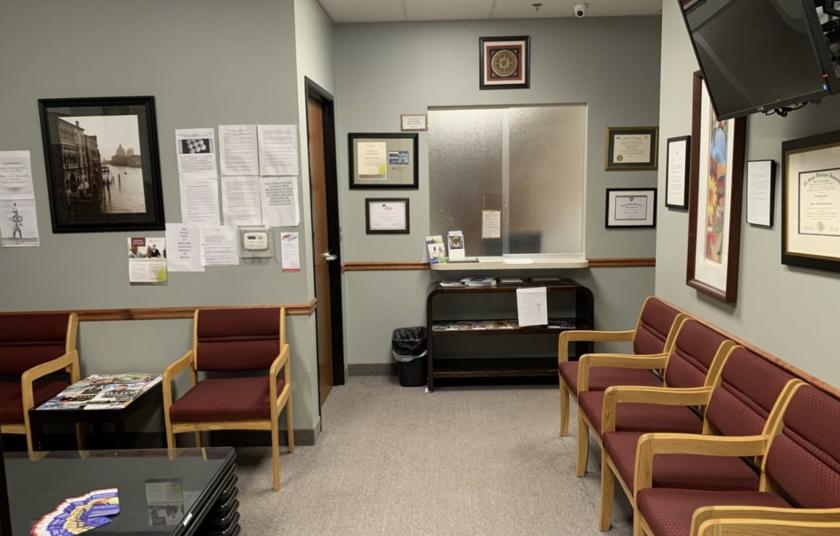
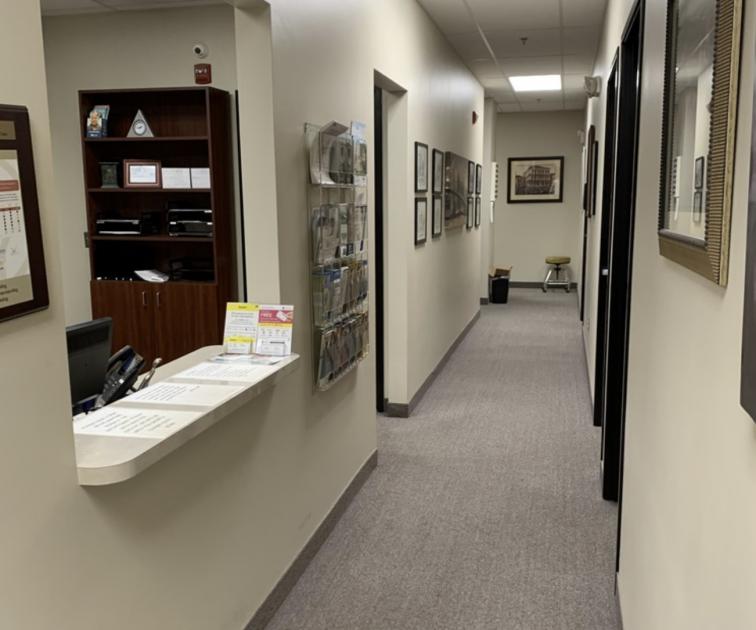
- • Former neurological practice
- • Directly across from St. Joseph Mercy Hospital
Listing Agents

Andrew Bower
O: 248-324-2000
M: 248-848-4193
Andrew.bower@freg.com
O: 248-324-2000
M: 248-848-4193
Andrew.bower@freg.com
While we strive to provide the most accurate information, all listing information, and demographic data, is provided by third-parties. As such, MyEListing will not be responsible for the accuracy of the information. It is strongly recommended that you verify all information with the listing agent, and any relevant agencies, prior to making any decisions.