Retail Space
4401 Pennell Road Aston, PA 19014
4401 Pennell Road Aston, PA 19014
Details & Description
Property Highlights
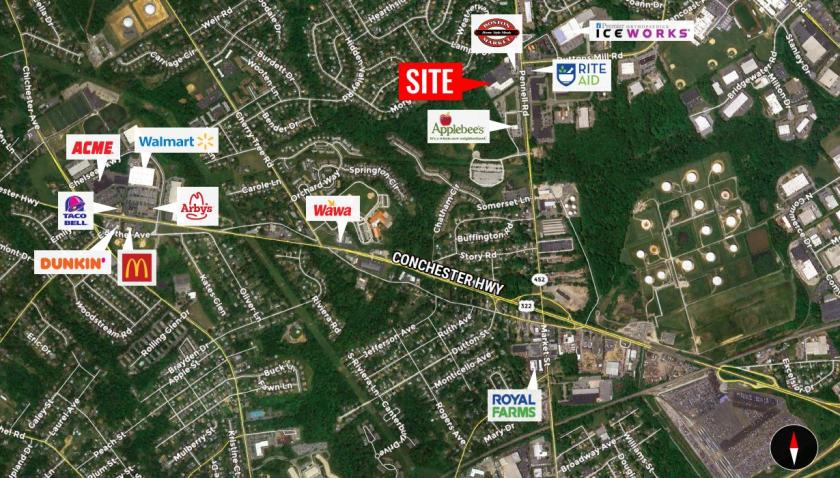
• Located minutes to Rt. 322, I-95, Rt. 1, Rt. 202 and Philadelphia International Airport.
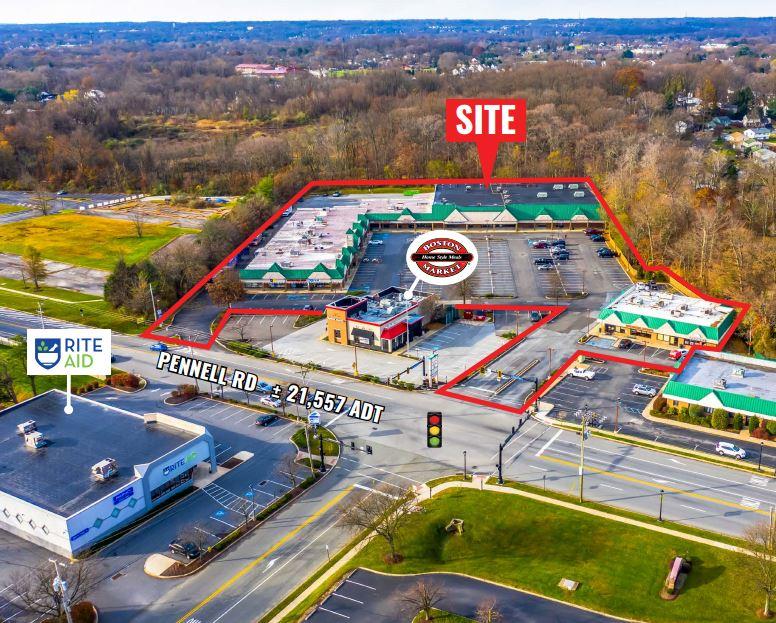
• The property consists of two separate buildings and 16 retail spaces.
Listing Agents

Scott McCabe
O: 610-359-1100
M: 610-357-8564
smccabe@zmcre.com
O: 610-359-1100
M: 610-357-8564
smccabe@zmcre.com
While we strive to provide the most accurate information, all listing information, and demographic data, is provided by third-parties. As such, MyEListing will not be responsible for the accuracy of the information. It is strongly recommended that you verify all information with the listing agent, and any relevant agencies, prior to making any decisions.