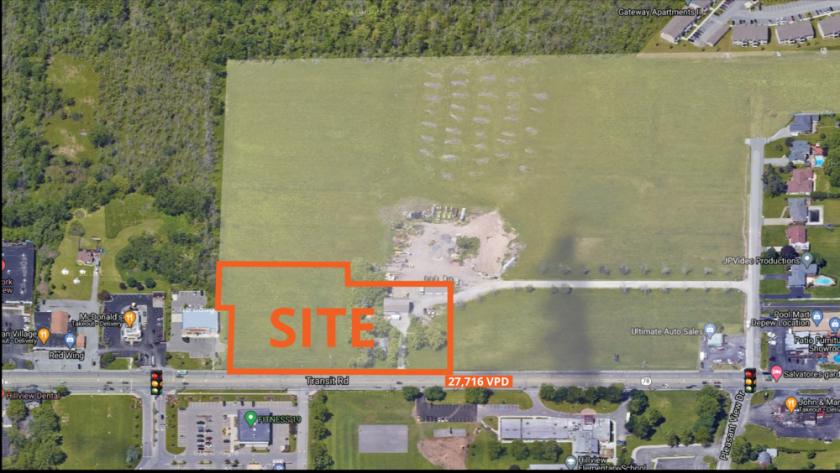
1-Mile | 3-Miles | 5-Miles | ||
---|---|---|---|---|
Total Population | 7,048 | 55,769 | 164,621 | |
Population Median Age | 44 | 42 | 42 | |
Population by Age | 0-9 Yrs | 685 (9%) | 5846 (10%) | 17126 (10%) |
10-19 Yrs | 705 (10%) | 5921 (10%) | 17283 (10%) | |
20-29 Yrs | 877 (12%) | 6758 (12%) | 20748 (12%) | |
30-39 Yrs | 836 (11%) | 7420 (13%) | 20564 (12%) | |
40-49 Yrs | 633 (8%) | 6316 (11%) | 18936 (11%) | |
50-59 Yrs | 1235 (17%) | 8464 (15%) | 24518 (14%) | |
60-69 Yrs | 1018 (14%) | 7039 (12%) | 21172 (12%) | |
70+ Yrs | 1059 (15%) | 8006 (14%) | 24274 (14%) | |
Median HH Income | $58,871 | $63,556 | $66,429 | |
Total Household Income | < 24K | 599 (19%) | 4109 (16%) | 11754 (16%) |
25-49K | 744 (24%) | 5640 (22%) | 15228 (21%) | |
50-74K | 601 (19%) | 4693 (19%) | 13732 (19%) | |
75-99K | 411 (13%) | 3451 (14%) | 9765 (13%) | |
100-199K | 609 (19%) | 5579 (22%) | 17815 (24%) | |
200K+ | 119 (3%) | 1089 (4%) | 3975 (5%) | |
Highest Education Level | No Diploma | 241 | 2005 | 5704 |
Diploma or GED | 1830 | 13770 | 34800 | |
Some College | 1117 | 8105 | 22197 | |
Assoc. Degree | 680 | 4958 | 14276 | |
Bachelors Degree | 899 | 7187 | 24376 | |
Higher Degree | 577 | 4941 | 19749 | |
Total Housing Units | 3,126 | 25,782 | 75,763 | |
--Owner-Occupied | 2,476 | 17,761 | 52,202 | |
--Renter-Occupied | 605 | 6,799 | 20,067 | |
Owner-Occupied Values | < 100K | 830 | 3564 | 9098 |
100-199K | 1253 | 10292 | 27070 | |
200-299K | 257 | 2424 | 10269 | |
300-399K | 125 | 849 | 3407 | |
400-499K | 0 | 294 | 1068 | |
500K+ | 11 | 340 | 1290 | |
Total Working Age Population | 6,027 | 46,582 | 137,277 | |
In Work Force | 3,900 | 30,746 | 89,822 | |
Not In Work Force | 2,128 | 15,836 | 47,454 | |
Workforce Employed | 3,751 | 29,606 | 86,787 | |
Workforce Unemployed | 148 | 1,095 | 2,934 | |
Civlian Workforce | 3,900 | 30,701 | 89,722 | |
Military Workforce | 0 | 45 | 101 | |
Total Households | 3,082 | 24,560 | 72,269 | |
Family Households | 1,935 | 14,739 | 43,079 | |
Non-Family Households | 1,147 | 9,821 | 29,190 | |
Married Couple | 1,438 | 10,940 | 33,169 | |
Other Family | 497 | 3,799 | 9,910 | |
Married w/Child | 437 | 3,629 | 11,904 | |
Single Male w/Child | 48 | 498 | 1,138 | |
Single Female w/Child | 204 | 1,361 | 3,607 |
Population Change Last Two Decades - Plus Projection
2000 | % | 2010 | % | 2020 | % | 2030 | |
---|---|---|---|---|---|---|---|
New York | 18,976,457 | +2 | 19,378,102 | +4 | 20,146,131 | +2 | 20,604,030 |
Erie County | 950,265 | -3 | 919,040 | +2 | 936,084 | +1 | 949,073 |
Total Working Age Population:
Total Households:
Total Working Age Population:
Total Households:
Total Working Age Population:
Total Households: