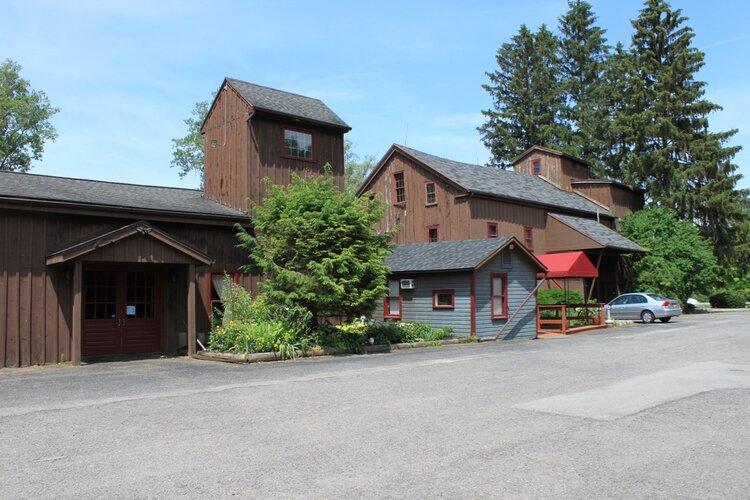
1-Mile | 3-Miles | 5-Miles | ||
---|---|---|---|---|
Total Population | 4,352 | 65,271 | 220,123 | |
Population Median Age | 48 | 42 | 40 | |
Population by Age | 0-9 Yrs | 294 (6%) | 6046 (9%) | 22651 (10%) |
10-19 Yrs | 348 (7%) | 7174 (10%) | 25107 (11%) | |
20-29 Yrs | 448 (10%) | 9167 (14%) | 35039 (15%) | |
30-39 Yrs | 483 (11%) | 8812 (13%) | 30472 (13%) | |
40-49 Yrs | 462 (10%) | 7100 (10%) | 23935 (10%) | |
50-59 Yrs | 670 (15%) | 9471 (14%) | 29445 (13%) | |
60-69 Yrs | 781 (17%) | 8558 (13%) | 25166 (11%) | |
70+ Yrs | 866 (19%) | 8944 (13%) | 28308 (12%) | |
Median HH Income | $98,824 | $72,724 | $59,325 | |
Total Household Income | < 24K | 155 (8%) | 4119 (14%) | 20021 (20%) |
25-49K | 268 (13%) | 5504 (19%) | 20875 (21%) | |
50-74K | 323 (16%) | 5051 (17%) | 17102 (17%) | |
75-99K | 226 (11%) | 4037 (14%) | 11505 (11%) | |
100-199K | 793 (41%) | 7486 (26%) | 20404 (21%) | |
200K+ | 160 (8%) | 2288 (8%) | 6303 (6%) | |
Highest Education Level | No Diploma | 166 | 2894 | 13798 |
Diploma or GED | 448 | 7940 | 30968 | |
Some College | 403 | 7380 | 24799 | |
Assoc. Degree | 349 | 4923 | 15085 | |
Bachelors Degree | 1091 | 12930 | 37862 | |
Higher Degree | 1078 | 12015 | 34428 | |
Total Housing Units | 2,013 | 30,501 | 105,464 | |
--Owner-Occupied | 1,677 | 20,554 | 55,312 | |
--Renter-Occupied | 248 | 7,932 | 40,897 | |
Owner-Occupied Values | < 100K | 99 | 3401 | 11345 |
100-199K | 962 | 10514 | 24904 | |
200-299K | 392 | 3803 | 11425 | |
300-399K | 207 | 1686 | 4526 | |
400-499K | 6 | 452 | 1420 | |
500K+ | 12 | 697 | 1692 | |
Total Working Age Population | 3,840 | 55,779 | 182,908 | |
In Work Force | 2,459 | 37,238 | 120,386 | |
Not In Work Force | 1,381 | 18,541 | 62,522 | |
Workforce Employed | 2,367 | 35,966 | 114,102 | |
Workforce Unemployed | 92 | 1,264 | 6,245 | |
Civlian Workforce | 2,459 | 37,230 | 120,348 | |
Military Workforce | 0 | 8 | 38 | |
Total Households | 1,926 | 28,486 | 96,209 | |
Family Households | 1,206 | 16,047 | 51,355 | |
Non-Family Households | 720 | 12,440 | 44,853 | |
Married Couple | 1,067 | 12,608 | 35,597 | |
Other Family | 139 | 3,439 | 15,758 | |
Married w/Child | 314 | 4,270 | 12,503 | |
Single Male w/Child | 13 | 460 | 1,447 | |
Single Female w/Child | 38 | 1,258 | 7,161 |
Population Change Last Two Decades - Plus Projection
2000 | % | 2010 | % | 2020 | % | 2030 | |
---|---|---|---|---|---|---|---|
New York | 18,976,457 | +2 | 19,378,102 | +4 | 20,146,131 | +2 | 20,604,030 |
Monroe County | 735,343 | +1 | 744,344 | +1 | 754,529 | +1 | 758,536 |
Total Working Age Population:
Total Households:
Total Working Age Population:
Total Households:
Total Working Age Population:
Total Households: