Office Space
20 West 3rd Street Media, PA 19063
20 West 3rd Street Media, PA 19063
Details & Description
Property Highlights
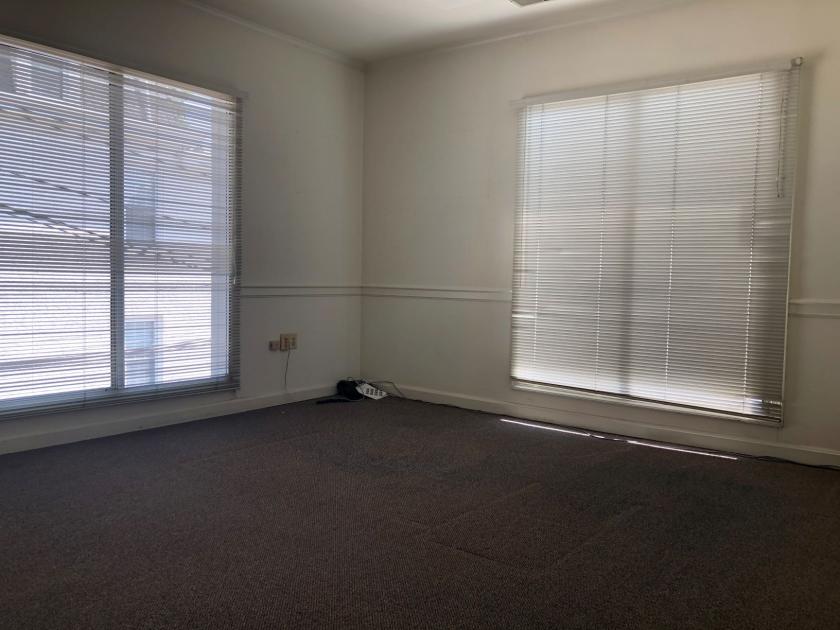
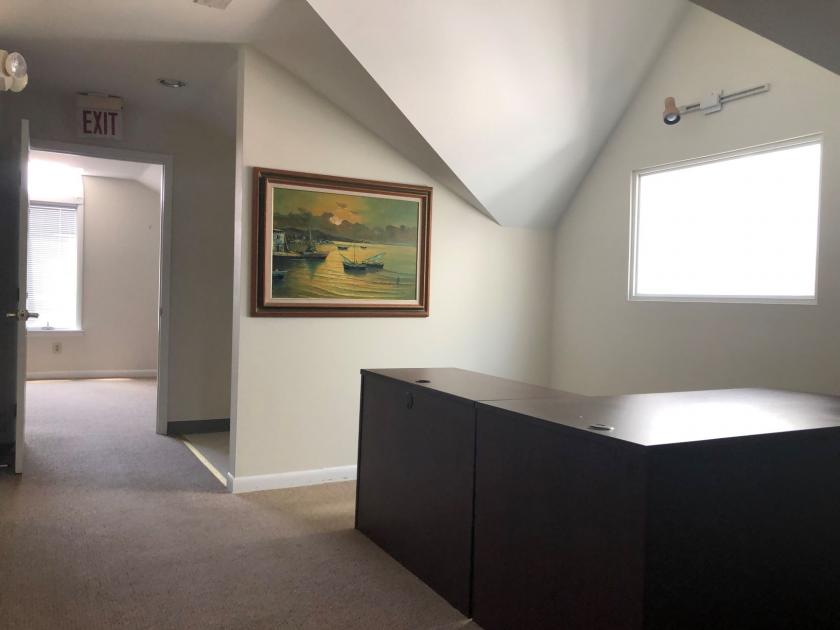
• - 600 sf 3rd floor office suite, with two offices, bathroom, and reception area. $1,200 per month, plus utilities.
• - 200 sf 1st floor office, with dedicated reception area desk. $750 per month, full service cleaning included.
Listing Agents

Steve Dibattista
O: 610-359-1100
M: 610-368-2801
sdibattista@zmcre.com
O: 610-359-1100
M: 610-368-2801
sdibattista@zmcre.com
While we strive to provide the most accurate information, all listing information, and demographic data, is provided by third-parties. As such, MyEListing will not be responsible for the accuracy of the information. It is strongly recommended that you verify all information with the listing agent, and any relevant agencies, prior to making any decisions.