Industrial Properties
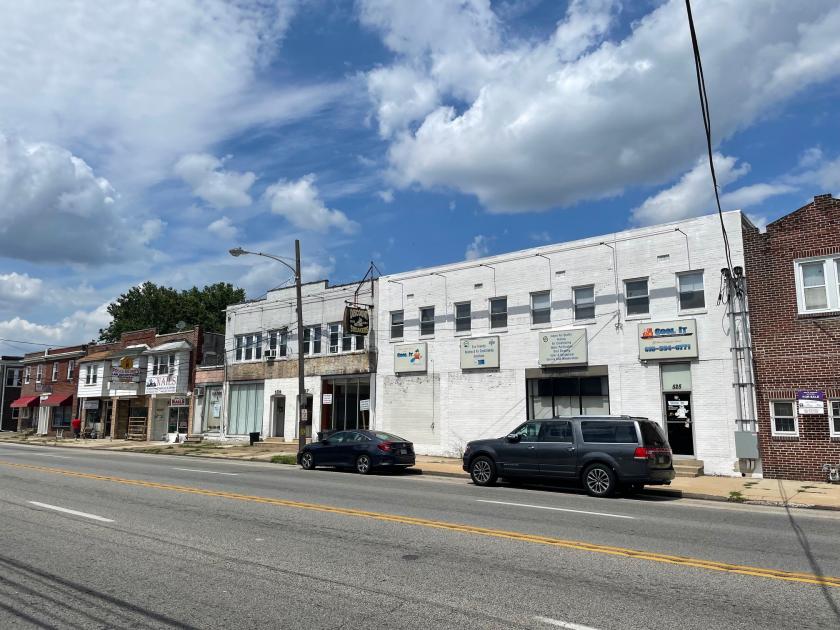
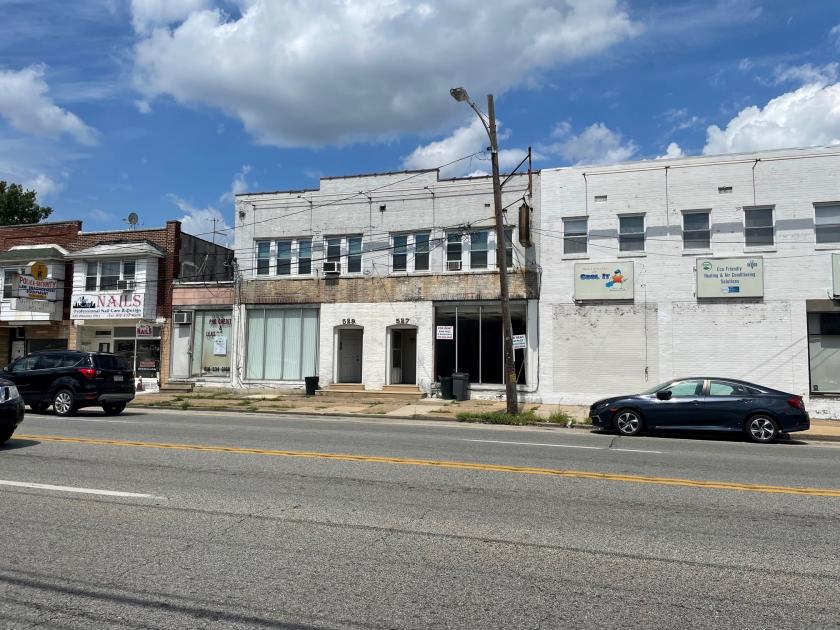
525 Chester Pike Prospect Park, PA 19076
525 Chester Pike Prospect Park, PA 19076
Details & Description
Property Highlights
- • Below market rates
- • Located on the heavily traveled Chester Pike
- • Please inquire for more details.
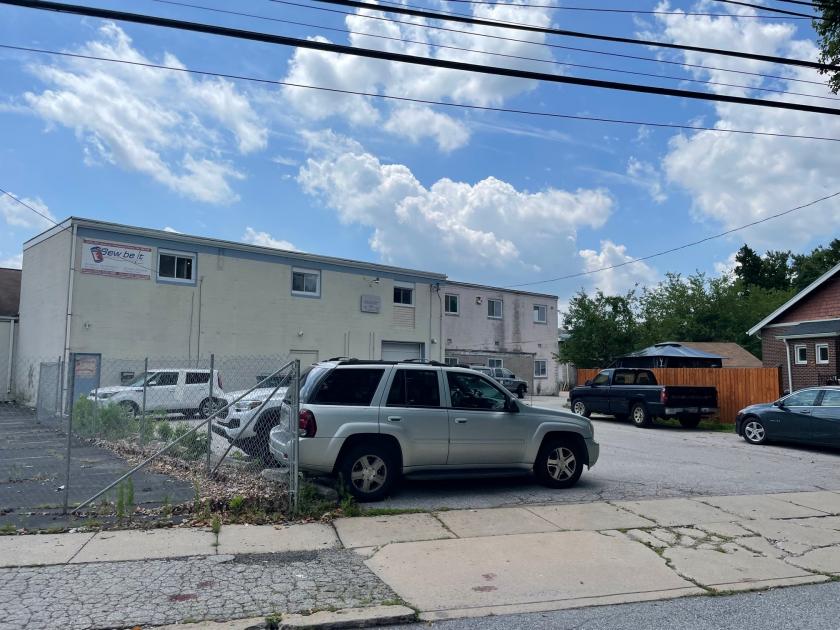
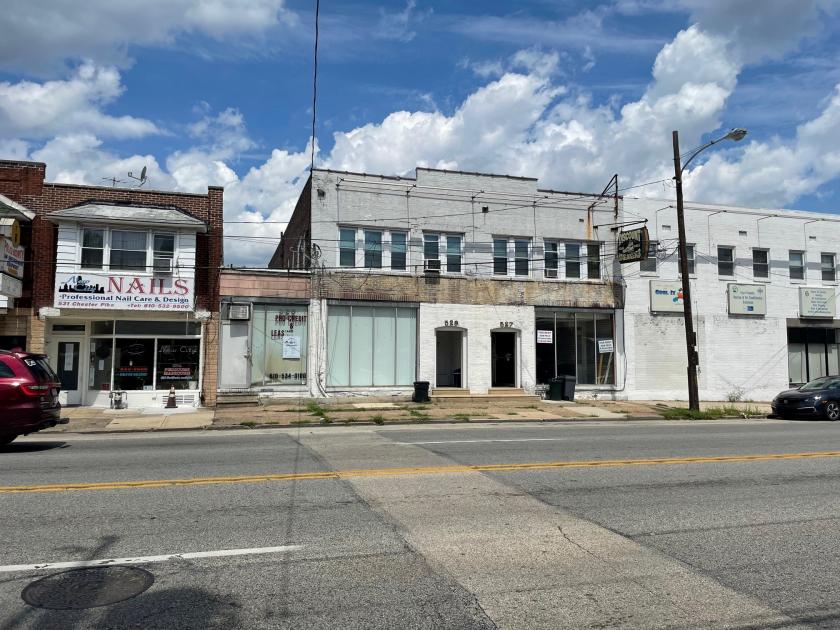
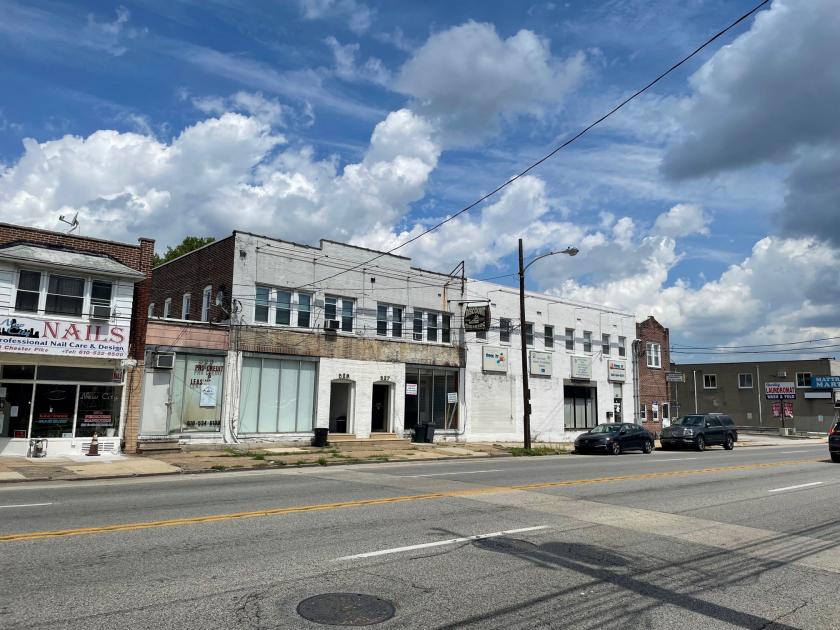
Additional Photos
Listing Agents

Ron Casey
O: 610-359-1100
M: 610-764-5826
rcasey@zmcre.com
O: 610-359-1100
M: 610-764-5826
rcasey@zmcre.com
While we strive to provide the most accurate information, all listing information, and demographic data, is provided by third-parties. As such, MyEListing will not be responsible for the accuracy of the information. It is strongly recommended that you verify all information with the listing agent, and any relevant agencies, prior to making any decisions.


