Retail Space
7759 Auburn Road Utica, MI 48317
7759 Auburn Road Utica, MI 48317
Details & Description
Property Highlights
• Property sits adjacent the new Jimmy Johns Field that seats 4,500 people.
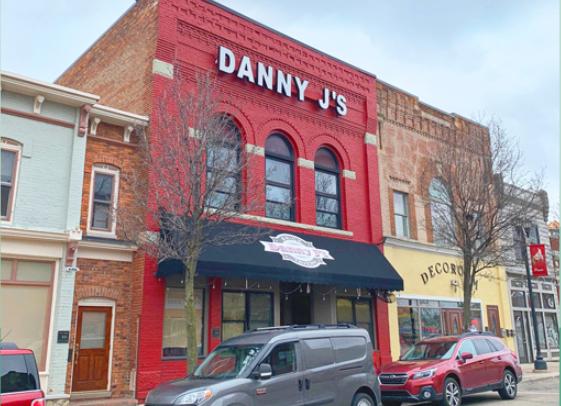
• This newly remodeled and renovated restaurant resides in Downtown Utica.
Listing Agents

Louis Ciotti
O: 248-488-2620
lciotti@landmarkcres.com
O: 248-488-2620
lciotti@landmarkcres.com
While we strive to provide the most accurate information, all listing information, and demographic data, is provided by third-parties. As such, MyEListing will not be responsible for the accuracy of the information. It is strongly recommended that you verify all information with the listing agent, and any relevant agencies, prior to making any decisions.


