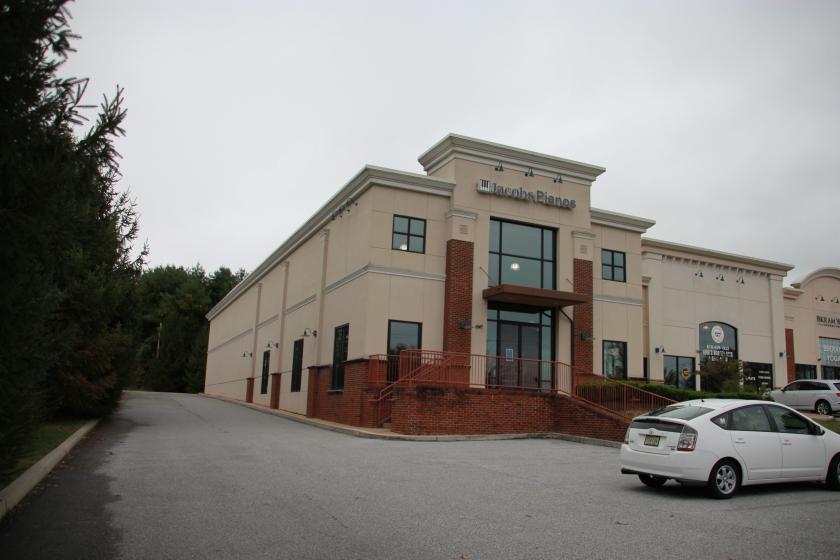
Retail Space
1572 Wilmington Pike West Chester, PA 19382
1572 Wilmington Pike West Chester, PA 19382

Details & Description
Property Highlights
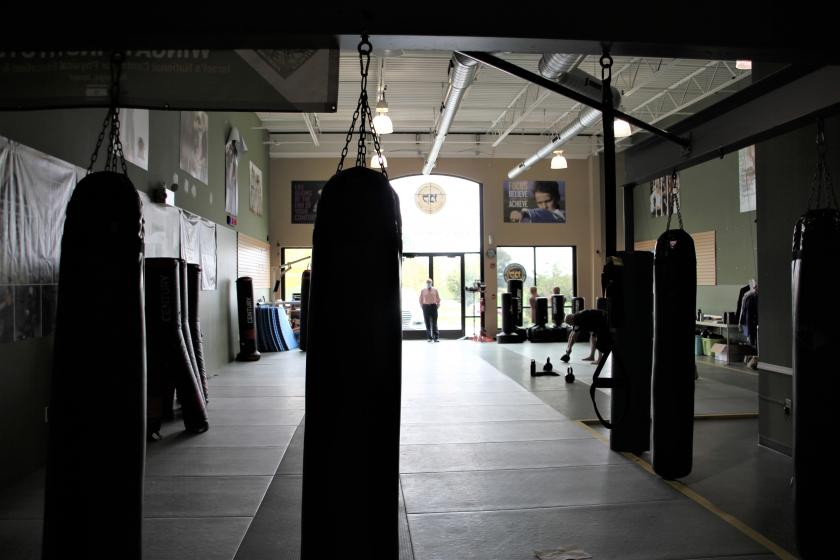
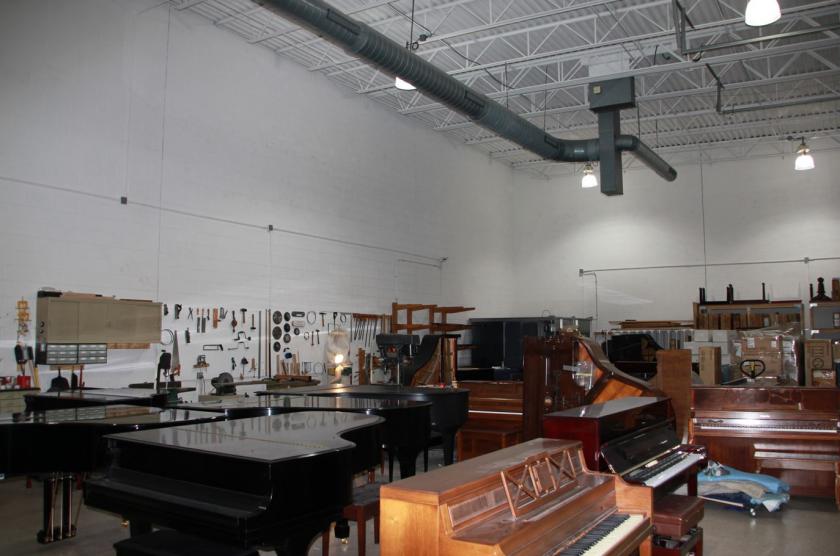
- • Three Suites Available Retail, Office, Medical
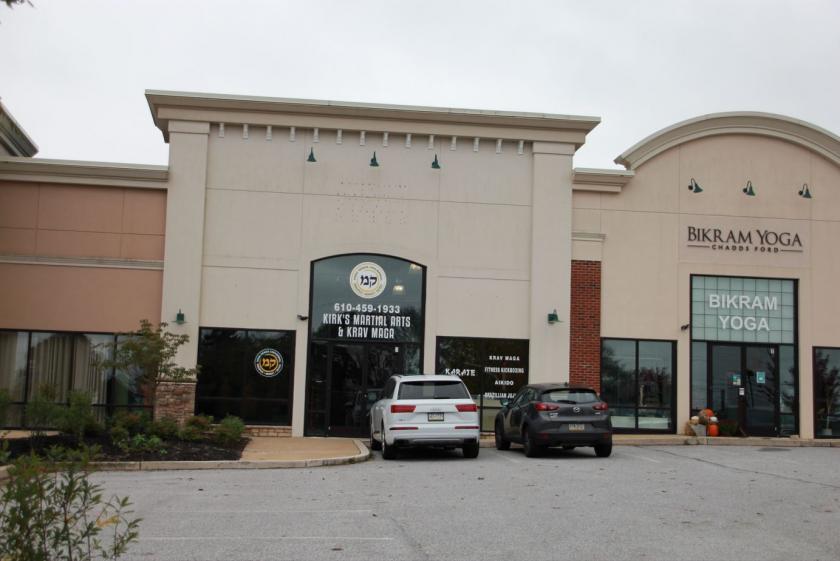
- • Located On Busy Route 202
- • Excellent Visibility Storefront
- • Ample Parking
Additional Photos
Listing Agents

Tess Scott
O: 610-359-1100
M: 610-401-3453
tscott@zmcre.com
O: 610-359-1100
M: 610-401-3453
tscott@zmcre.com
While we strive to provide the most accurate information, all listing information, and demographic data, is provided by third-parties. As such, MyEListing will not be responsible for the accuracy of the information. It is strongly recommended that you verify all information with the listing agent, and any relevant agencies, prior to making any decisions.


