Retail Space
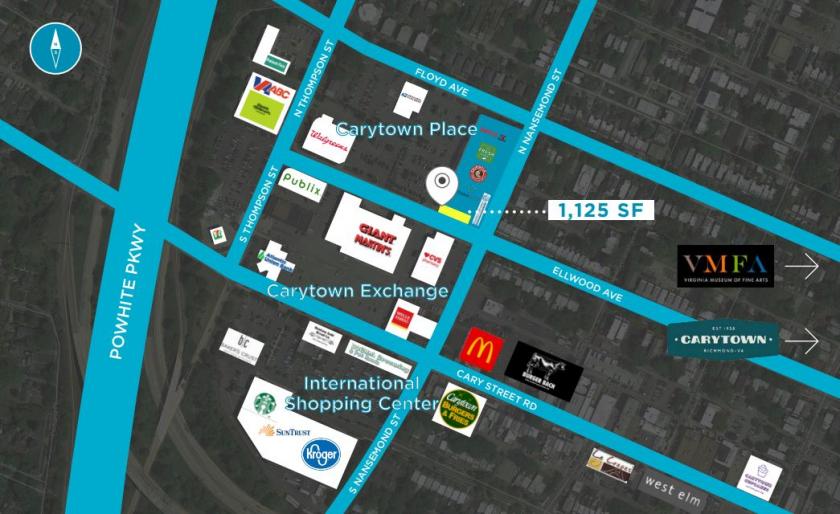
N Nansemond St at Ellwood Ave and Floyd Ave Richmond, VA 23221
N Nansemond St at Ellwood Ave and Floyd Ave Richmond, VA 23221
Details & Description
Property Highlights
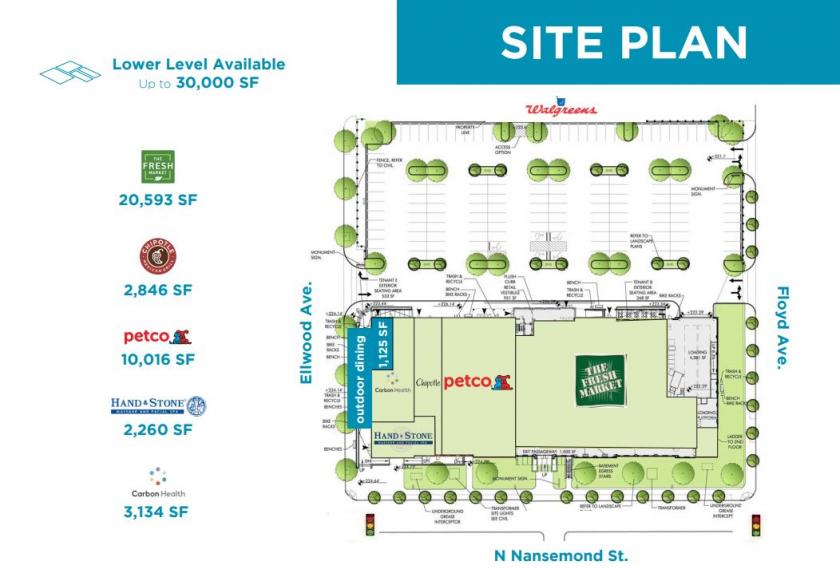
- • Up to 30,000 SF available on lower level
- • 5 minutes from 3 college campuses
- • Virginia Commonwealth University- 32,000 students
- • University of Richmond- 4,250 students
- • Virginia Union University- 1,600 students
- • Over 40,000 cars pass the site per day
Listing Agents

Michael Stoltz
O: 410-308-0700
mstoltz@mfirealty.com
O: 410-308-0700
mstoltz@mfirealty.com
While we strive to provide the most accurate information, all listing information, and demographic data, is provided by third-parties. As such, MyEListing will not be responsible for the accuracy of the information. It is strongly recommended that you verify all information with the listing agent, and any relevant agencies, prior to making any decisions.