Retail Space
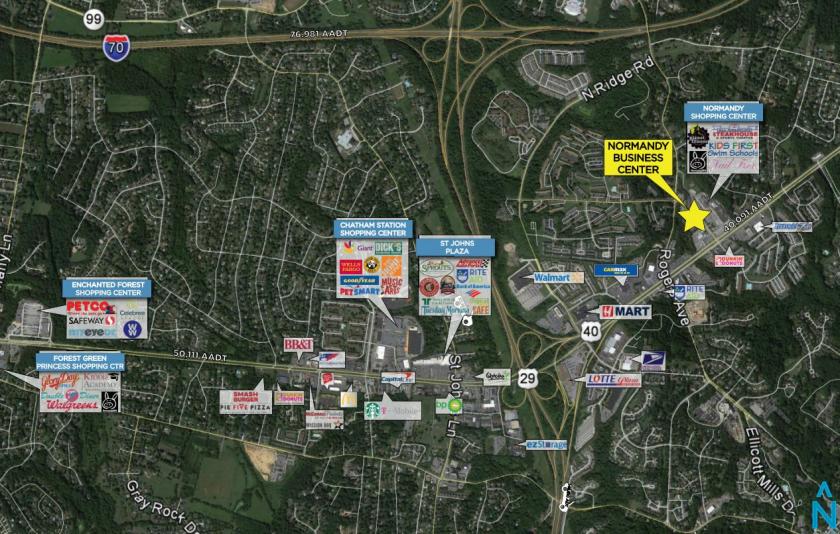
8480 Baltimore National Pike Ellicott City, MD 21043
8480 Baltimore National Pike Ellicott City, MD 21043
Details & Description
Property Highlights
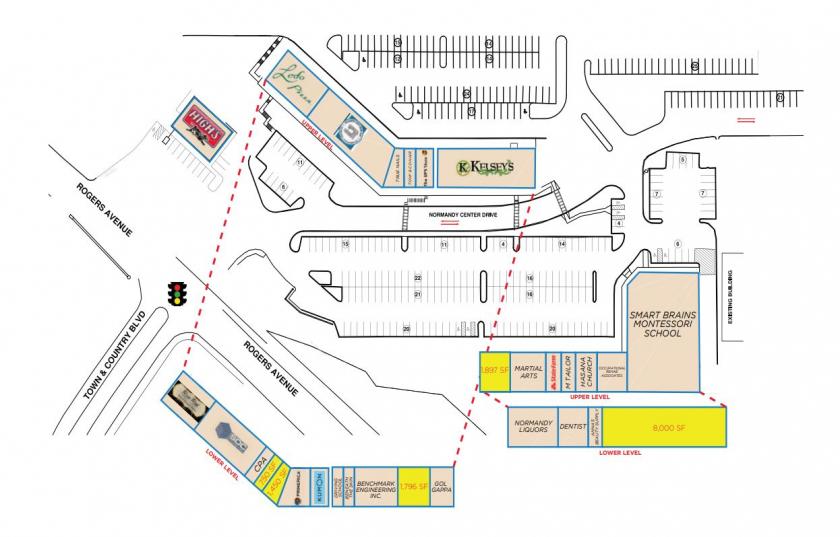
- • Inline Endcap spaces available for lease
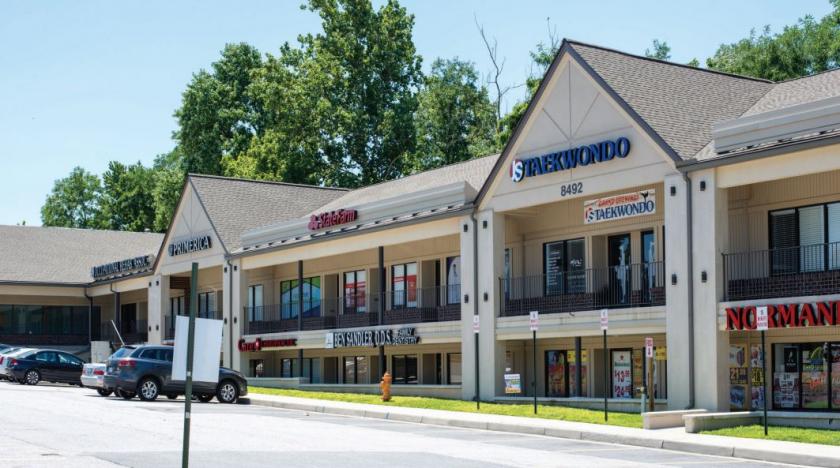
- • Great visibility from Baltimore National Pike
- • Great visibility from Baltimore National Pike
Listing Agents

Michael Stoltz
O: 410-308-0700
mstoltz@mfirealty.com
O: 410-308-0700
mstoltz@mfirealty.com
While we strive to provide the most accurate information, all listing information, and demographic data, is provided by third-parties. As such, MyEListing will not be responsible for the accuracy of the information. It is strongly recommended that you verify all information with the listing agent, and any relevant agencies, prior to making any decisions.