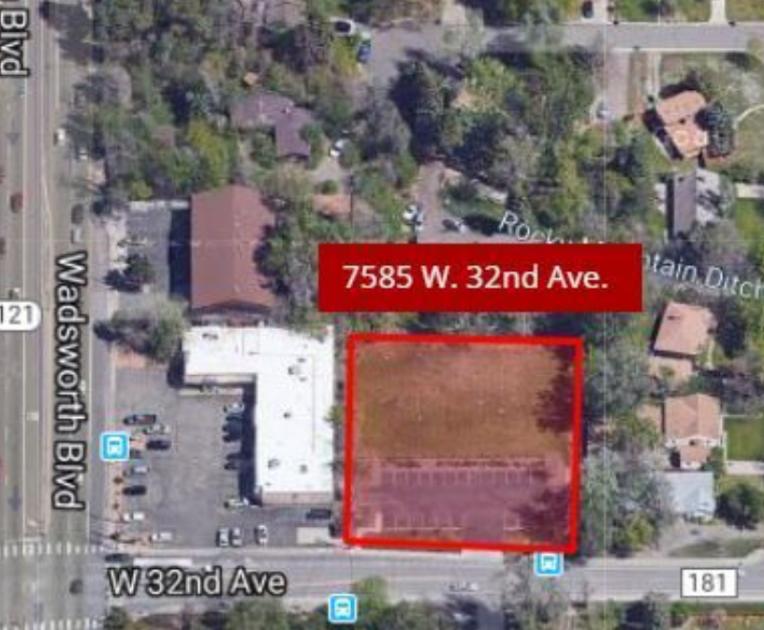
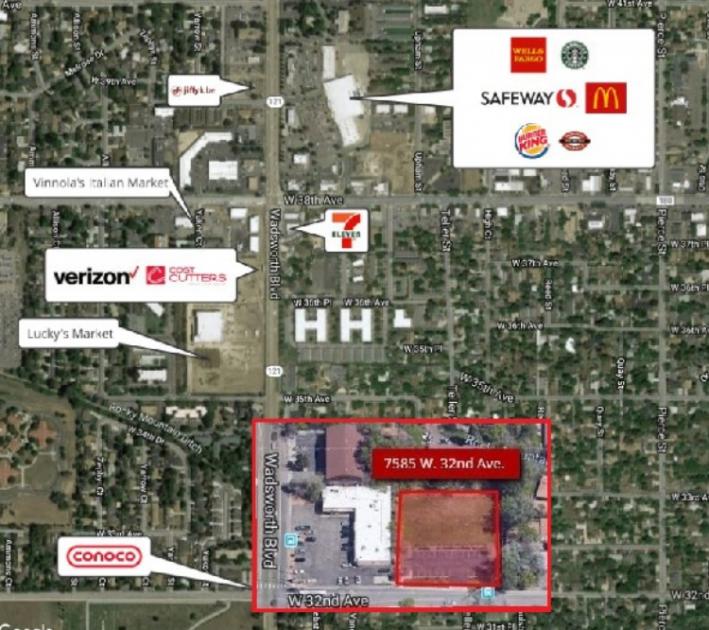
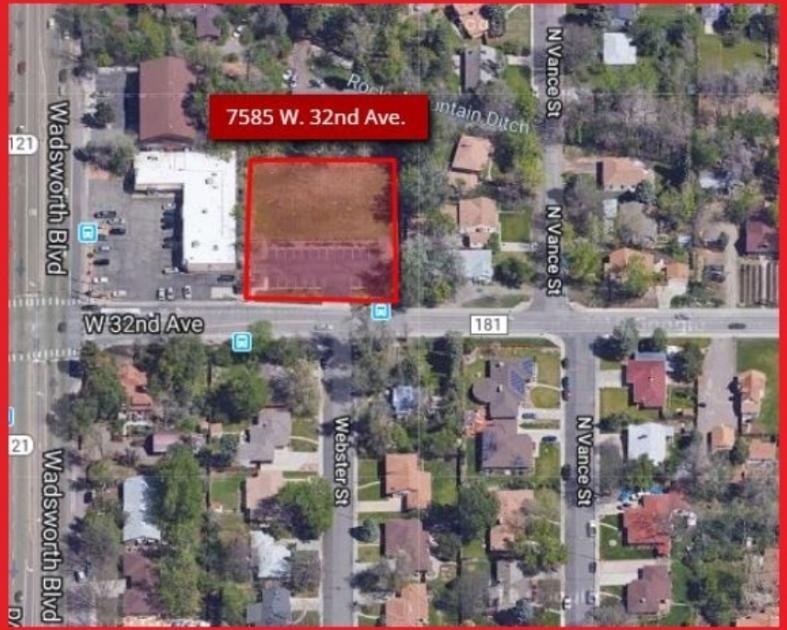
1-Mile | 3-Miles | 5-Miles | ||
---|---|---|---|---|
Total Population | 12,020 | 131,793 | 367,302 | |
Population Median Age | 43 | 39 | 38 | |
Population by Age | 0-9 Yrs | 1082 (9%) | 14459 (10%) | 40470 (11%) |
10-19 Yrs | 1003 (8%) | 11417 (8%) | 37874 (10%) | |
20-29 Yrs | 1798 (14%) | 21107 (16%) | 63893 (17%) | |
30-39 Yrs | 1875 (15%) | 24301 (18%) | 65426 (17%) | |
40-49 Yrs | 1328 (11%) | 17626 (13%) | 46638 (12%) | |
50-59 Yrs | 1512 (12%) | 15340 (11%) | 42143 (11%) | |
60-69 Yrs | 1439 (11%) | 14323 (10%) | 37281 (10%) | |
70+ Yrs | 1983 (16%) | 13219 (10%) | 33577 (9%) | |
Median HH Income | $59,306 | $62,138 | $65,778 | |
Total Household Income | < 24K | 1203 (21%) | 11777 (19%) | 29152 (18%) |
25-49K | 1119 (20%) | 12343 (20%) | 30361 (19%) | |
50-74K | 1004 (18%) | 10358 (17%) | 27720 (17%) | |
75-99K | 697 (12%) | 7192 (12%) | 20268 (13%) | |
100-199K | 1125 (20%) | 12894 (21%) | 36527 (23%) | |
200K+ | 336 (6%) | 4464 (7%) | 11436 (7%) | |
Highest Education Level | No Diploma | 768 | 10923 | 32741 |
Diploma or GED | 2374 | 21000 | 60568 | |
Some College | 2162 | 19599 | 50515 | |
Assoc. Degree | 495 | 6113 | 16214 | |
Bachelors Degree | 2275 | 25848 | 67824 | |
Higher Degree | 1206 | 14527 | 36979 | |
Total Housing Units | 5,699 | 62,223 | 164,872 | |
--Owner-Occupied | 2,762 | 29,872 | 80,521 | |
--Renter-Occupied | 2,721 | 29,157 | 74,943 | |
Owner-Occupied Values | < 100K | 61 | 844 | 2329 |
100-199K | 120 | 1755 | 6464 | |
200-299K | 453 | 4558 | 15922 | |
300-399K | 764 | 6903 | 20662 | |
400-499K | 926 | 6643 | 15712 | |
500K+ | 439 | 9170 | 19432 | |
Total Working Age Population | 10,295 | 109,797 | 304,517 | |
In Work Force | 6,952 | 77,107 | 213,988 | |
Not In Work Force | 3,344 | 32,690 | 90,529 | |
Workforce Employed | 6,695 | 73,931 | 205,253 | |
Workforce Unemployed | 257 | 3,108 | 8,623 | |
Civlian Workforce | 6,952 | 77,039 | 213,876 | |
Military Workforce | 0 | 68 | 112 | |
Total Households | 5,483 | 59,029 | 155,464 | |
Family Households | 2,729 | 29,524 | 80,709 | |
Non-Family Households | 2,755 | 29,505 | 74,754 | |
Married Couple | 2,051 | 20,817 | 56,846 | |
Other Family | 677 | 8,707 | 23,864 | |
Married w/Child | 631 | 7,837 | 21,462 | |
Single Male w/Child | 97 | 1,198 | 3,395 | |
Single Female w/Child | 231 | 2,980 | 8,116 |
Population Change Last Two Decades - Plus Projection
2000 | % | 2010 | % | 2020 | % | 2030 | |
---|---|---|---|---|---|---|---|
Colorado | 4,301,261 | +17 | 5,029,196 | +16 | 5,838,181 | +15 | 6,733,658 |
Adams County | 363,857 | +21 | 441,603 | +20 | 530,680 | +21 | 642,318 |
Arapahoe County | 487,967 | +17 | 572,003 | +16 | 662,304 | +13 | 750,773 |
Denver County | 554,636 | +8 | 600,158 | +23 | 738,611 | +12 | 827,681 |
Jefferson County | 527,056 | +1 | 534,543 | +10 | 587,118 | +7 | 626,742 |
Total Working Age Population:
Total Households:
Total Working Age Population:
Total Households:
Total Working Age Population:
Total Households: