Retail Space
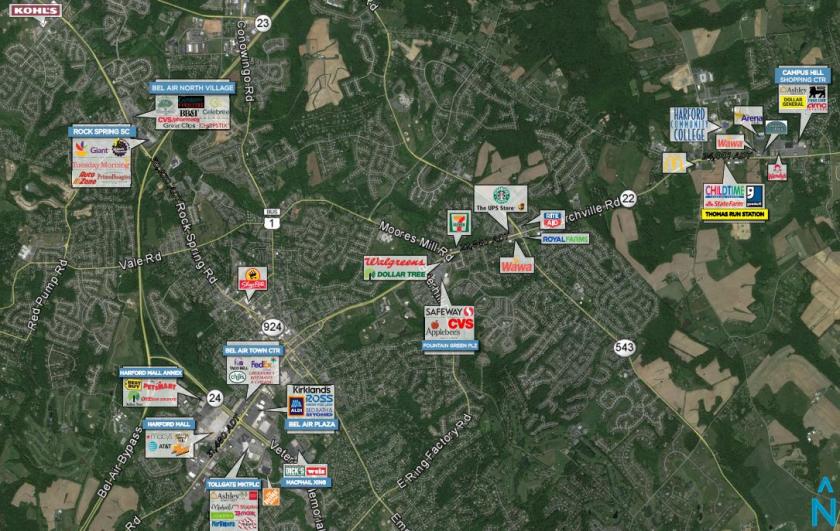
2217 East Churchville Road Bel Air, MD 21015
2217 East Churchville Road Bel Air, MD 21015
Details & Description
Property Highlights
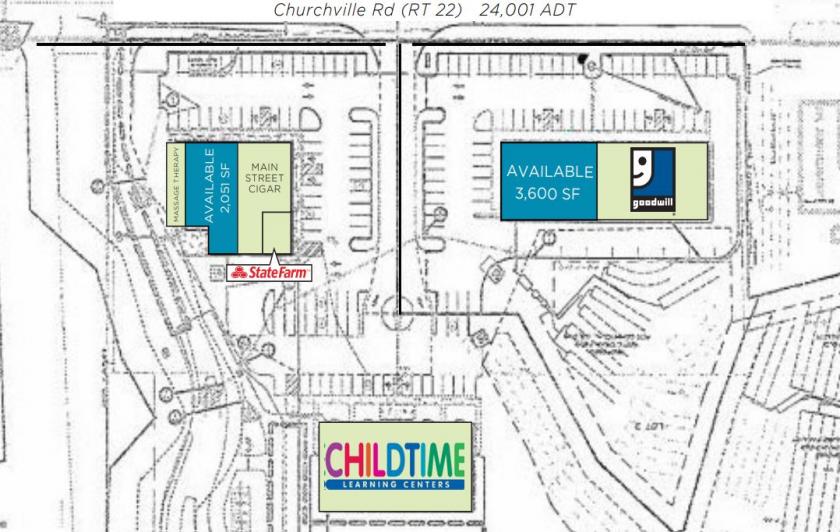
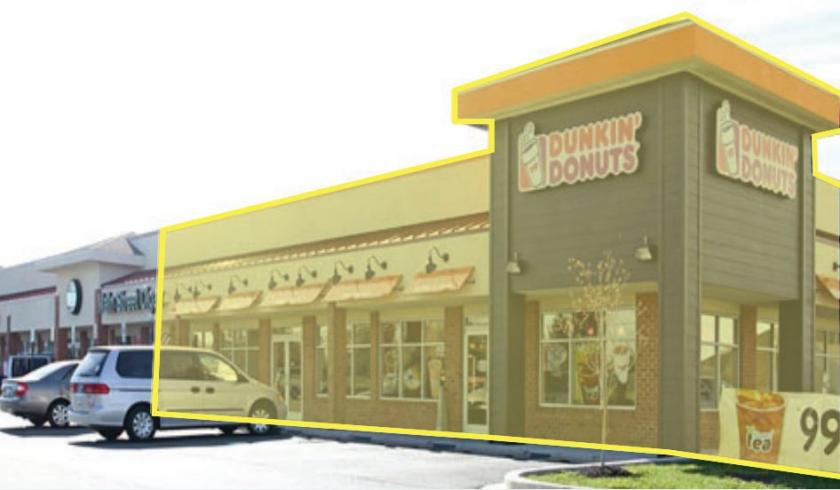
- • 3,600 SF is a 2nd generation restaurant
- • Abundance of parking on site
- • Over 24,000 cars passing the site daily
Listing Agents

Michael Kociemba
O: 410-308-0700
mk@mfirealty.com
O: 410-308-0700
mk@mfirealty.com
While we strive to provide the most accurate information, all listing information, and demographic data, is provided by third-parties. As such, MyEListing will not be responsible for the accuracy of the information. It is strongly recommended that you verify all information with the listing agent, and any relevant agencies, prior to making any decisions.