Retail Space
412 Constant Friendship Boulevard Abingdon, MD 21009
412 Constant Friendship Boulevard Abingdon, MD 21009
Details & Description
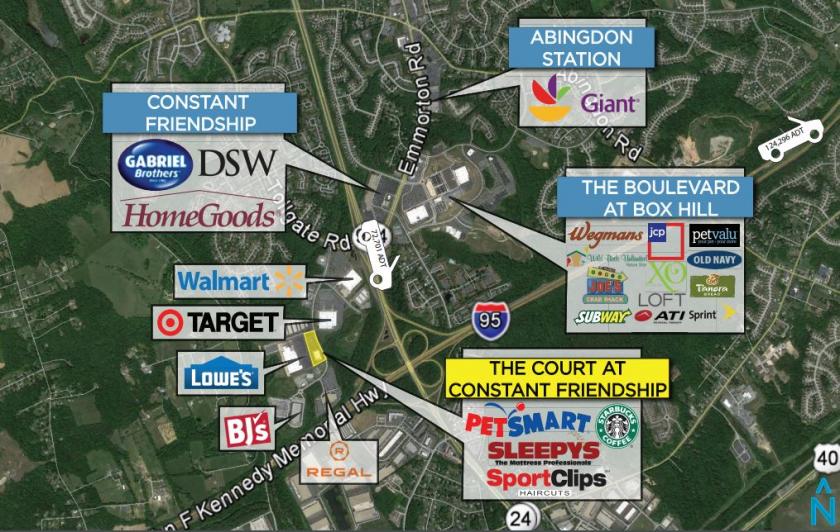
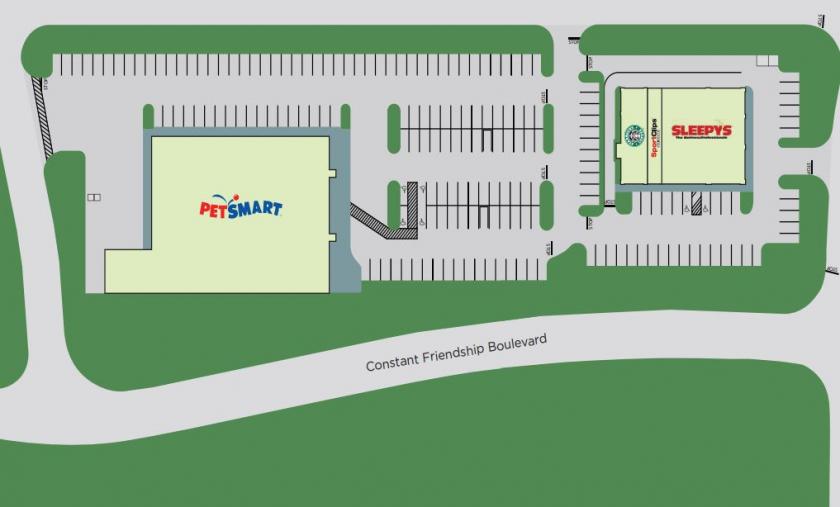
Property Highlights
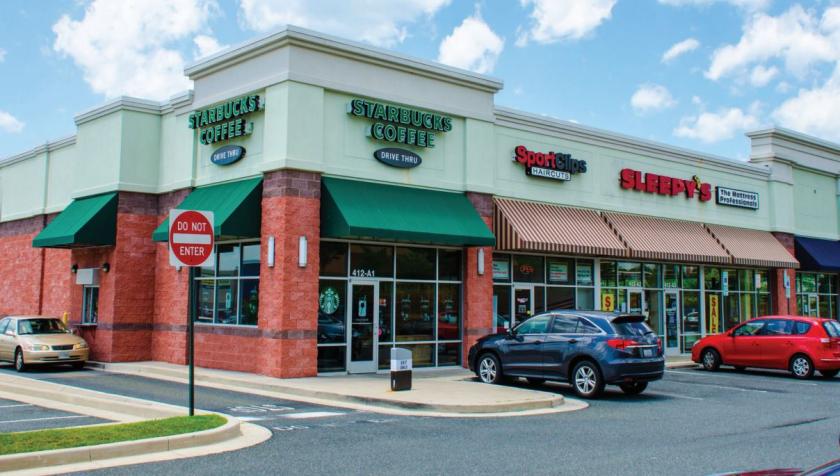
- • Join PetSmart, Starbucks, Sport Clips and Sleepys
- • Multiple ingress and egress points
- • Nearby residential housing and schools
Listing Agents

Michael Kociemba
O: 410-308-0700
mk@mfirealty.com
O: 410-308-0700
mk@mfirealty.com
While we strive to provide the most accurate information, all listing information, and demographic data, is provided by third-parties. As such, MyEListing will not be responsible for the accuracy of the information. It is strongly recommended that you verify all information with the listing agent, and any relevant agencies, prior to making any decisions.