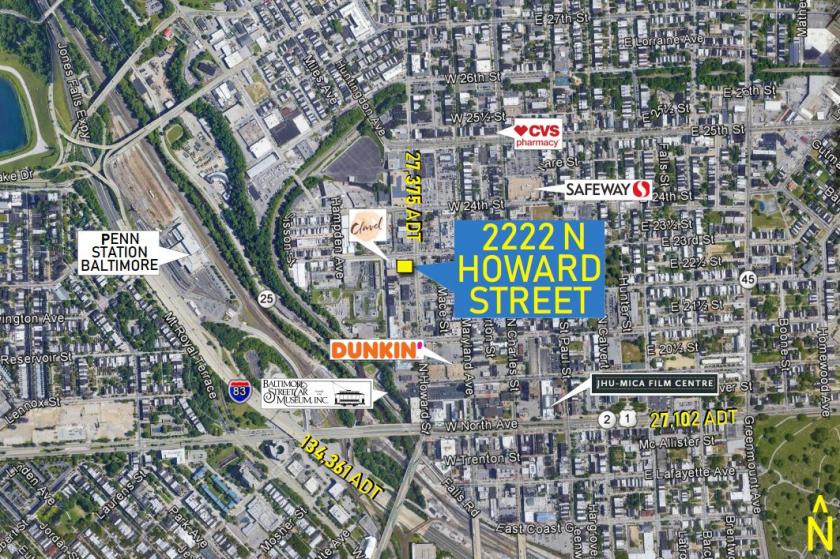
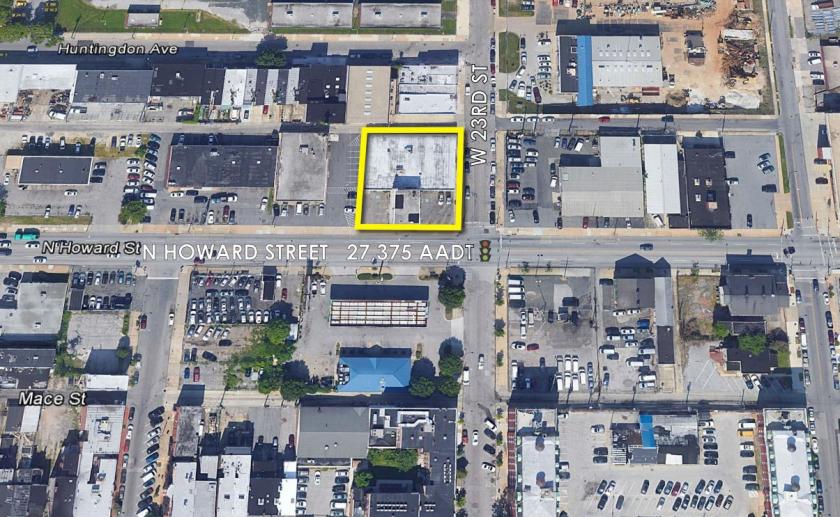
1-Mile | 3-Miles | 5-Miles | ||
---|---|---|---|---|
Total Population | 40,902 | 302,080 | 599,262 | |
Population Median Age | 37 | 37 | 38 | |
Population by Age | 0-9 Yrs | 3913 (9%) | 32922 (10%) | 71262 (11%) |
10-19 Yrs | 3787 (9%) | 34021 (11%) | 65773 (10%) | |
20-29 Yrs | 8912 (21%) | 59504 (19%) | 105313 (17%) | |
30-39 Yrs | 8063 (19%) | 50006 (16%) | 97592 (16%) | |
40-49 Yrs | 4145 (10%) | 31426 (10%) | 66015 (11%) | |
50-59 Yrs | 5104 (12%) | 38229 (12%) | 76351 (12%) | |
60-69 Yrs | 4510 (11%) | 31740 (10%) | 64571 (10%) | |
70+ Yrs | 2466 (6%) | 24232 (8%) | 52385 (8%) | |
Median HH Income | $44,926 | $47,492 | $53,224 | |
Total Household Income | < 24K | 6166 (32%) | 37159 (30%) | 62636 (26%) |
25-49K | 4045 (21%) | 25282 (20%) | 50286 (21%) | |
50-74K | 2906 (15%) | 18234 (15%) | 38120 (16%) | |
75-99K | 1917 (10%) | 11549 (9%) | 25542 (10%) | |
100-199K | 2962 (15%) | 20153 (16%) | 43681 (18%) | |
200K+ | 1085 (5%) | 8371 (6%) | 17187 (7%) | |
Highest Education Level | No Diploma | 3818 | 31901 | 58671 |
Diploma or GED | 5838 | 57410 | 115624 | |
Some College | 5074 | 36232 | 78254 | |
Assoc. Degree | 1498 | 8772 | 19933 | |
Bachelors Degree | 6756 | 37720 | 76147 | |
Higher Degree | 6513 | 37603 | 70643 | |
Total Housing Units | 23,693 | 156,707 | 291,568 | |
--Owner-Occupied | 5,832 | 49,932 | 113,622 | |
--Renter-Occupied | 13,251 | 70,817 | 123,832 | |
Owner-Occupied Values | < 100K | 1065 | 13764 | 25708 |
100-199K | 1413 | 14935 | 40184 | |
200-299K | 1698 | 9507 | 21671 | |
300-399K | 922 | 4658 | 10786 | |
400-499K | 453 | 2445 | 5783 | |
500K+ | 280 | 4624 | 9490 | |
Total Working Age Population | 35,252 | 251,034 | 490,120 | |
In Work Force | 23,138 | 151,127 | 308,684 | |
Not In Work Force | 12,114 | 99,907 | 181,435 | |
Workforce Employed | 21,451 | 137,712 | 283,646 | |
Workforce Unemployed | 1,629 | 13,157 | 24,338 | |
Civlian Workforce | 23,079 | 150,869 | 307,984 | |
Military Workforce | 58 | 258 | 700 | |
Total Households | 19,082 | 120,749 | 237,453 | |
Family Households | 6,586 | 54,193 | 119,134 | |
Non-Family Households | 12,496 | 66,556 | 118,319 | |
Married Couple | 3,282 | 24,926 | 58,998 | |
Other Family | 3,304 | 29,267 | 60,136 | |
Married w/Child | 937 | 7,894 | 20,549 | |
Single Male w/Child | 334 | 2,276 | 4,798 | |
Single Female w/Child | 1,300 | 11,352 | 23,191 |
Population Change Last Two Decades - Plus Projection
2000 | % | 2010 | % | 2020 | % | 2030 | |
---|---|---|---|---|---|---|---|
Maryland | 5,296,486 | +9 | 5,773,552 | +6 | 6,141,900 | +6 | 6,518,750 |
Baltimore County | 754,292 | +7 | 805,029 | +5 | 847,000 | +2 | 862,200 |
Harford County | 218,590 | +12 | 244,826 | +5 | 257,700 | +5 | 271,850 |
Howard County | 247,842 | +16 | 287,085 | +17 | 336,900 | +9 | 366,800 |
Baltimore city | 651,154 | -5 | 620,961 | -1 | 616,300 | +1 | 625,100 |
Total Working Age Population:
Total Households:
Total Working Age Population:
Total Households:
Total Working Age Population:
Total Households: