Retail Space
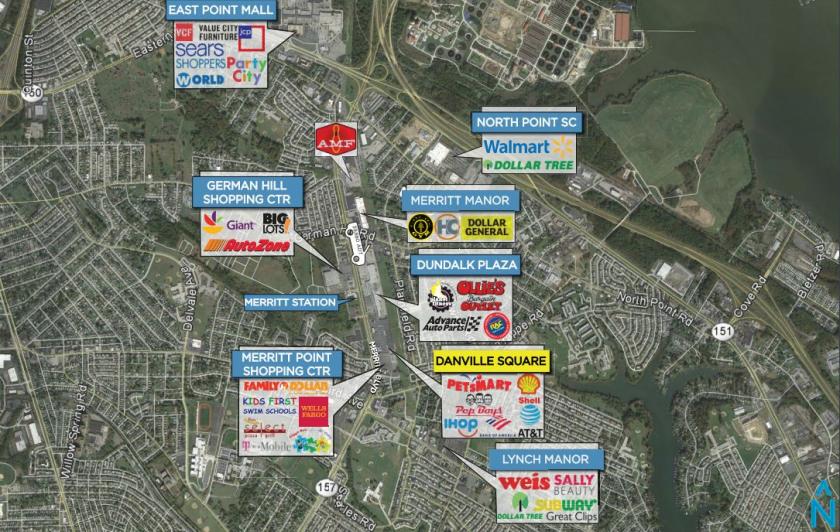
1407 Merritt Boulevard Dundalk, MD 21222
1407 Merritt Boulevard Dundalk, MD 21222
Details & Description
Property Highlights
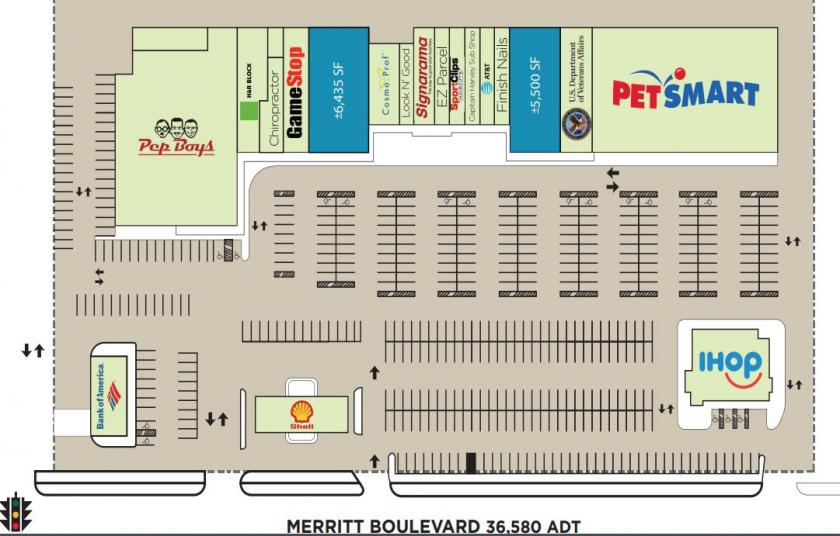
- • 6,435 SF 5,500 SF available for lease
- • Site provides excellent access and visibility
- • Pylon signage available
Listing Agents

Michael Kociemba
O: 410-308-0700
mk@mfirealty.com
O: 410-308-0700
mk@mfirealty.com
While we strive to provide the most accurate information, all listing information, and demographic data, is provided by third-parties. As such, MyEListing will not be responsible for the accuracy of the information. It is strongly recommended that you verify all information with the listing agent, and any relevant agencies, prior to making any decisions.