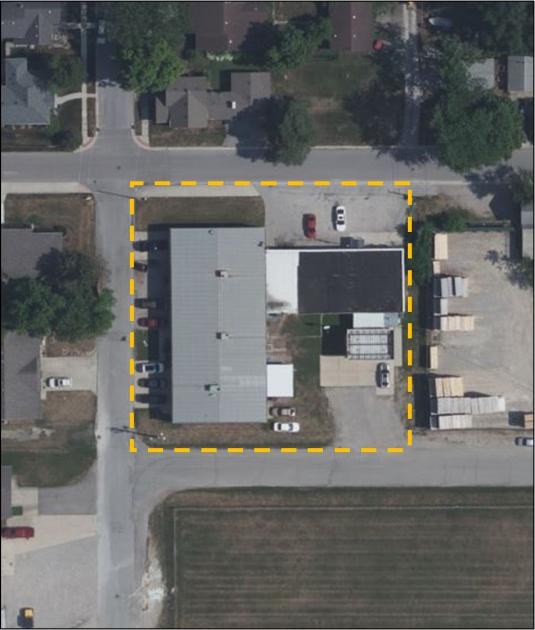
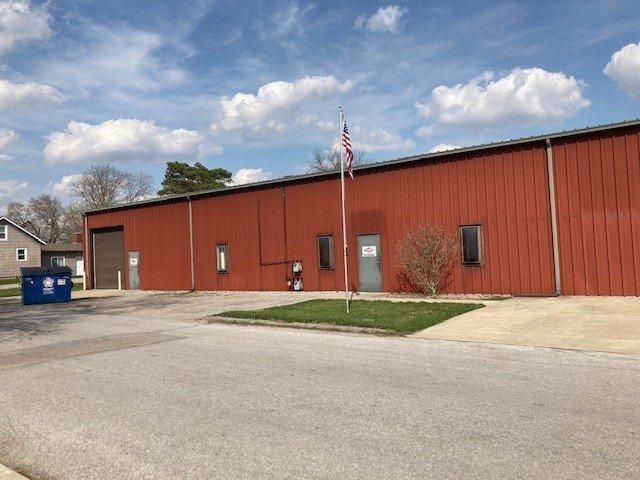
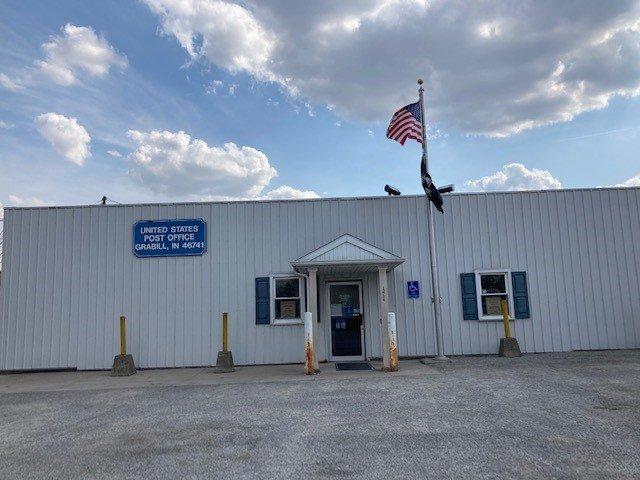
1-Mile | 3-Miles | 5-Miles | ||
---|---|---|---|---|
Total Population | 1,741 | 7,315 | 19,612 | |
Population Median Age | 36 | 36 | 37 | |
Population by Age | 0-9 Yrs | 286 (16%) | 1105 (15%) | 2709 (13%) |
10-19 Yrs | 259 (14%) | 1337 (18%) | 3623 (18%) | |
20-29 Yrs | 212 (12%) | 749 (10%) | 1960 (9%) | |
30-39 Yrs | 250 (14%) | 902 (12%) | 2068 (10%) | |
40-49 Yrs | 182 (10%) | 880 (12%) | 2766 (14%) | |
50-59 Yrs | 227 (13%) | 843 (11%) | 2656 (13%) | |
60-69 Yrs | 188 (10%) | 800 (10%) | 2184 (11%) | |
70+ Yrs | 136 (7%) | 700 (9%) | 1647 (8%) | |
Median HH Income | $58,648 | $70,422 | $82,087 | |
Total Household Income | < 24K | 94 (15%) | 309 (12%) | 595 (9%) |
25-49K | 149 (23%) | 468 (19%) | 1108 (16%) | |
50-74K | 131 (21%) | 527 (21%) | 1242 (18%) | |
75-99K | 103 (16%) | 404 (16%) | 1206 (18%) | |
100-199K | 135 (21%) | 621 (25%) | 2085 (31%) | |
200K+ | 9 (1%) | 85 (3%) | 337 (5%) | |
Highest Education Level | No Diploma | 124 | 753 | 1505 |
Diploma or GED | 341 | 1233 | 2874 | |
Some College | 236 | 845 | 2438 | |
Assoc. Degree | 178 | 684 | 1750 | |
Bachelors Degree | 139 | 636 | 2532 | |
Higher Degree | 44 | 263 | 1145 | |
Total Housing Units | 644 | 2,521 | 6,813 | |
--Owner-Occupied | 532 | 2,155 | 6,032 | |
--Renter-Occupied | 89 | 258 | 541 | |
Owner-Occupied Values | < 100K | 182 | 413 | 690 |
100-199K | 270 | 895 | 2482 | |
200-299K | 26 | 392 | 1518 | |
300-399K | 27 | 245 | 794 | |
400-499K | 5 | 83 | 275 | |
500K+ | 21 | 128 | 272 | |
Total Working Age Population | 1,301 | 5,344 | 14,541 | |
In Work Force | 890 | 3,522 | 9,974 | |
Not In Work Force | 411 | 1,822 | 4,567 | |
Workforce Employed | 874 | 3,469 | 9,821 | |
Workforce Unemployed | 17 | 53 | 153 | |
Civlian Workforce | 890 | 3,522 | 9,974 | |
Military Workforce | 0 | 0 | 0 | |
Total Households | 621 | 2,413 | 6,573 | |
Family Households | 494 | 1,906 | 5,296 | |
Non-Family Households | 127 | 507 | 1,277 | |
Married Couple | 394 | 1,578 | 4,594 | |
Other Family | 101 | 328 | 702 | |
Married w/Child | 158 | 637 | 1,951 | |
Single Male w/Child | 13 | 66 | 131 | |
Single Female w/Child | 66 | 156 | 285 |
Population Change Last Two Decades - Plus Projection
2000 | % | 2010 | % | 2020 | % | 2030 | |
---|---|---|---|---|---|---|---|
Indiana | 6,080,485 | +7 | 6,483,802 | +4 | 6,738,573 | +4 | 7,014,880 |
Allen County | 331,849 | +7 | 355,329 | +7 | 379,671 | +6 | 402,948 |
DeKalb County | 40,285 | +5 | 42,223 | +2 | 43,060 | +2 | 44,032 |
Total Working Age Population:
Total Households:
Total Working Age Population:
Total Households:
Total Working Age Population:
Total Households: