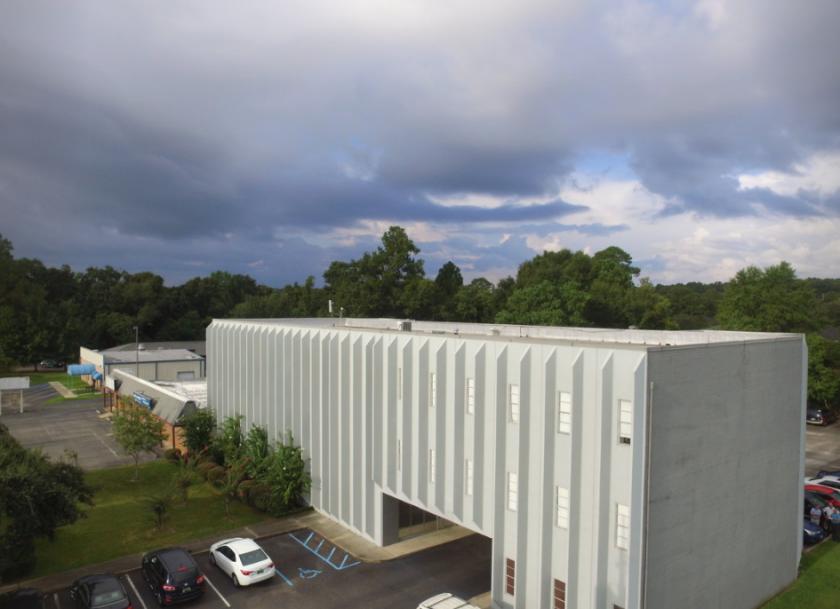
Office Space
762 Downtowner Loop West Mobile, AL 36609
762 Downtowner Loop West Mobile, AL 36609
Details & Description
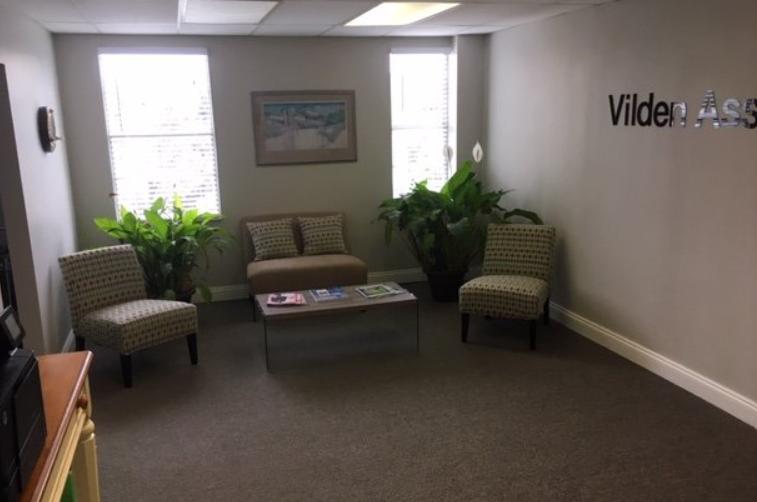
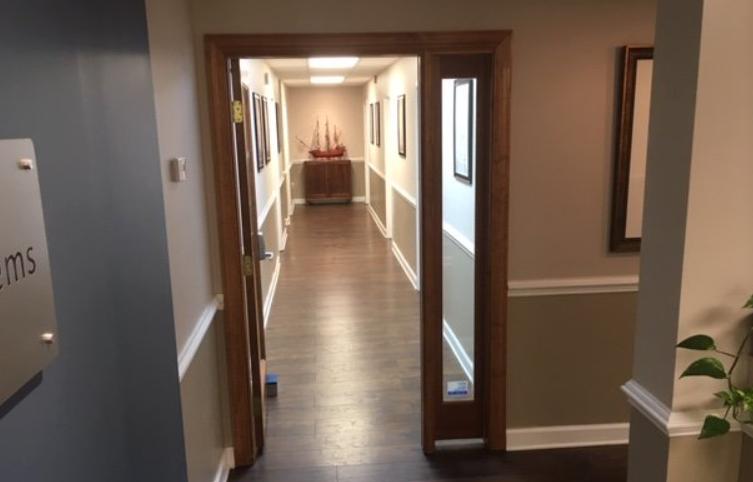
Additional Photos


Listing Agents

John Delchamps
O: 251-476-0808
M: 251-604-0615
john@merrillpthomasco.com
O: 251-476-0808
M: 251-604-0615
john@merrillpthomasco.com
While we strive to provide the most accurate information, all listing information, and demographic data, is provided by third-parties. As such, MyEListing will not be responsible for the accuracy of the information. It is strongly recommended that you verify all information with the listing agent, and any relevant agencies, prior to making any decisions.


