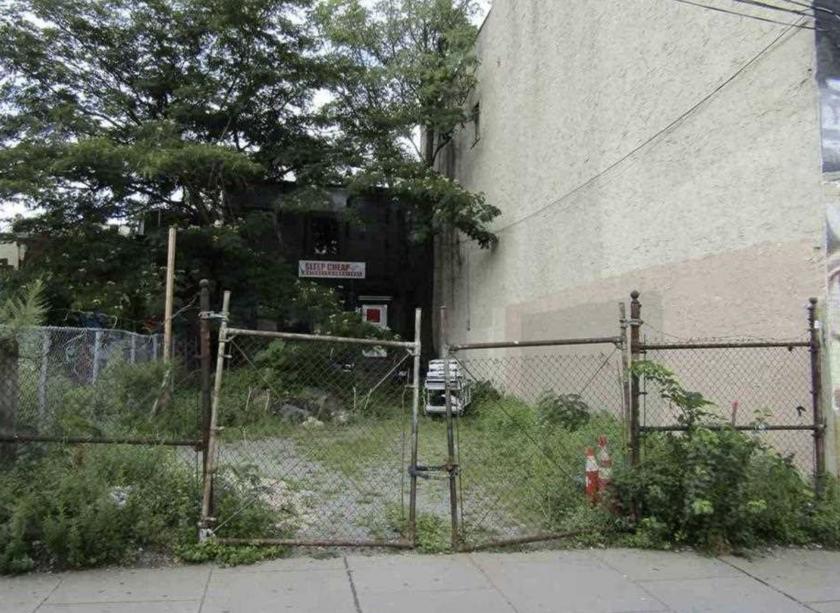
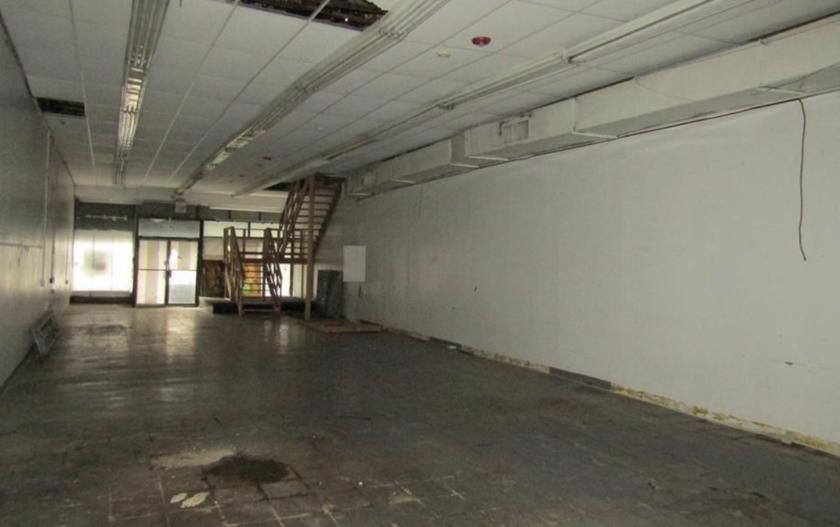
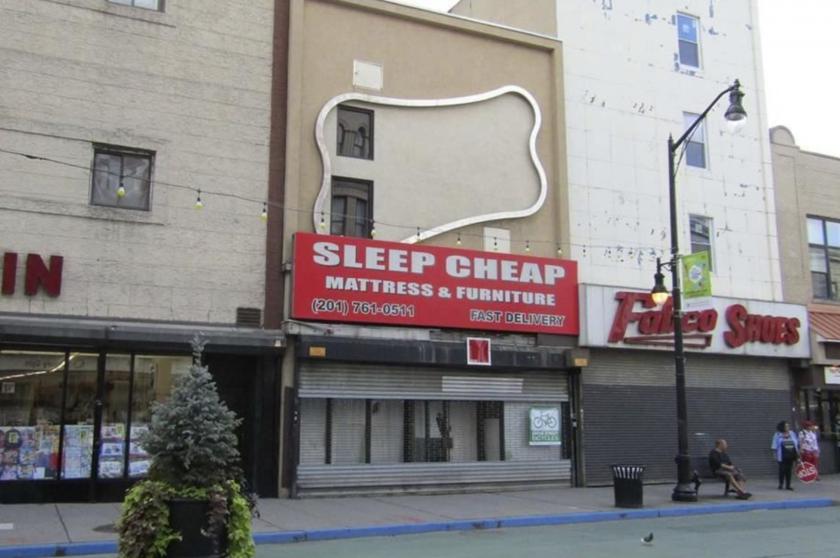
1-Mile | 3-Miles | 5-Miles | ||
---|---|---|---|---|
Total Population | 81,334 | 651,128 | 1,609,298 | |
Population Median Age | 35 | 37 | 38 | |
Population by Age | 0-9 Yrs | 8955 (11%) | 70047 (10%) | 172182 (10%) |
10-19 Yrs | 3182 (3%) | 46819 (7%) | 126189 (7%) | |
20-29 Yrs | 16410 (20%) | 122491 (18%) | 300577 (18%) | |
30-39 Yrs | 28007 (34%) | 154578 (23%) | 354223 (22%) | |
40-49 Yrs | 11045 (13%) | 85673 (13%) | 213609 (13%) | |
50-59 Yrs | 6125 (7%) | 66925 (10%) | 169835 (10%) | |
60-69 Yrs | 4060 (4%) | 55934 (8%) | 141401 (8%) | |
70+ Yrs | 3552 (4%) | 48661 (7%) | 131282 (8%) | |
Median HH Income | $144,452 | $108,495 | $99,829 | |
Total Household Income | < 24K | 4370 (11%) | 48119 (16%) | 128737 (17%) |
25-49K | 2334 (6%) | 34123 (11%) | 90286 (12%) | |
50-74K | 3144 (8%) | 29718 (10%) | 76088 (10%) | |
75-99K | 2890 (7%) | 25971 (8%) | 68535 (9%) | |
100-199K | 13432 (34%) | 75689 (25%) | 185723 (25%) | |
200K+ | 12592 (32%) | 79235 (27%) | 176995 (24%) | |
Highest Education Level | No Diploma | 2910 | 52393 | 130629 |
Diploma or GED | 5469 | 65533 | 168839 | |
Some College | 4568 | 41642 | 109441 | |
Assoc. Degree | 1335 | 15155 | 41161 | |
Bachelors Degree | 24553 | 175691 | 417508 | |
Higher Degree | 27109 | 143548 | 340315 | |
Total Housing Units | 43,143 | 331,750 | 825,177 | |
--Owner-Occupied | 8,842 | 81,022 | 195,935 | |
--Renter-Occupied | 29,919 | 211,832 | 530,430 | |
Owner-Occupied Values | < 100K | 134 | 2287 | 6220 |
100-199K | 138 | 2992 | 7058 | |
200-299K | 404 | 6784 | 14097 | |
300-399K | 782 | 8071 | 17938 | |
400-499K | 700 | 6408 | 16043 | |
500K+ | 6684 | 54480 | 134578 | |
Total Working Age Population | 70,363 | 554,788 | 1,365,706 | |
In Work Force | 56,506 | 401,240 | 968,456 | |
Not In Work Force | 13,856 | 153,547 | 397,250 | |
Workforce Employed | 54,823 | 383,667 | 924,451 | |
Workforce Unemployed | 1,670 | 17,441 | 43,608 | |
Civlian Workforce | 56,493 | 401,108 | 968,059 | |
Military Workforce | 13 | 132 | 398 | |
Total Households | 38,762 | 292,855 | 726,365 | |
Family Households | 19,746 | 142,416 | 338,390 | |
Non-Family Households | 19,016 | 150,439 | 387,975 | |
Married Couple | 16,772 | 106,389 | 246,961 | |
Other Family | 2,974 | 36,027 | 91,429 | |
Married w/Child | 6,990 | 44,118 | 101,755 | |
Single Male w/Child | 134 | 3,504 | 8,587 | |
Single Female w/Child | 1,086 | 12,009 | 29,901 |
Population Change Last Two Decades - Plus Projection
2000 | % | 2010 | % | 2020 | % | 2030 | |
---|---|---|---|---|---|---|---|
New Jersey | 8,414,350 | +4 | 8,791,894 | +4 | 9,132,700 | +4 | 9,530,900 |
Bergen County | 884,118 | +2 | 905,116 | +7 | 967,500 | +7 | 1,031,500 |
Essex County | 793,633 | -1 | 783,969 | +3 | 808,300 | +3 | 829,800 |
Hudson County | 608,975 | +4 | 634,266 | +12 | 708,100 | +6 | 747,400 |
Union County | 522,541 | +3 | 536,499 | +7 | 573,000 | +6 | 605,600 |
New York | 18,976,457 | +2 | 19,378,102 | +4 | 20,146,131 | +2 | 20,604,030 |
Kings County | 2,465,326 | +2 | 2,504,700 | +9 | 2,738,283 | +5 | 2,863,996 |
New York County | 1,537,195 | +3 | 1,585,873 | +6 | 1,688,894 | +2 | 1,727,631 |
Queens County | 2,229,379 | 0 | 2,230,722 | +9 | 2,436,549 | +5 | 2,565,268 |
Richmond County | 443,728 | +6 | 468,730 | +3 | 481,351 | +1 | 488,119 |
Total Working Age Population:
Total Households:
Total Working Age Population:
Total Households:
Total Working Age Population:
Total Households: