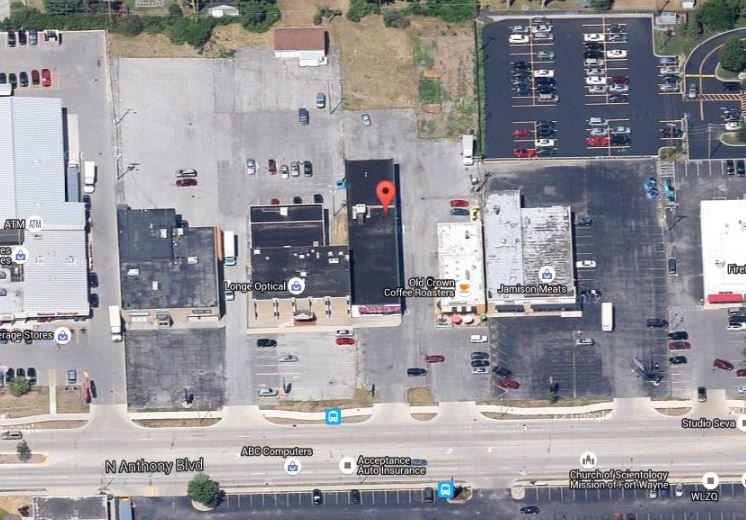
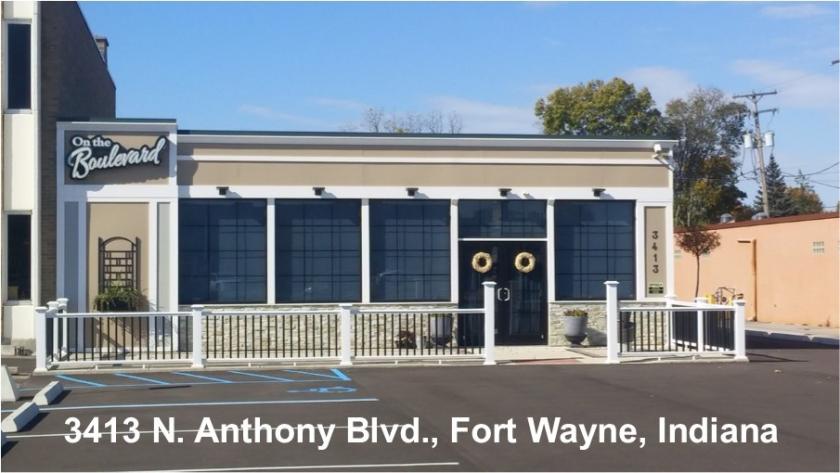
1-Mile | 3-Miles | 5-Miles | ||
---|---|---|---|---|
Total Population | 9,701 | 81,870 | 184,558 | |
Population Median Age | 37 | 36 | 36 | |
Population by Age | 0-9 Yrs | 1173 (12%) | 10921 (13%) | 26718 (14%) |
10-19 Yrs | 1471 (15%) | 10359 (12%) | 24851 (13%) | |
20-29 Yrs | 1565 (16%) | 15837 (19%) | 30634 (16%) | |
30-39 Yrs | 1203 (12%) | 11068 (13%) | 24869 (13%) | |
40-49 Yrs | 1268 (13%) | 8937 (10%) | 21625 (11%) | |
50-59 Yrs | 1216 (12%) | 8782 (10%) | 21058 (11%) | |
60-69 Yrs | 971 (10%) | 8509 (10%) | 18744 (10%) | |
70+ Yrs | 834 (8%) | 7458 (9%) | 16059 (8%) | |
Median HH Income | $50,927 | $43,080 | $45,951 | |
Total Household Income | < 24K | 788 (19%) | 9483 (27%) | 18565 (25%) |
25-49K | 1175 (29%) | 10232 (29%) | 21432 (28%) | |
50-74K | 907 (22%) | 6710 (19%) | 14640 (19%) | |
75-99K | 512 (12%) | 3802 (11%) | 8893 (12%) | |
100-199K | 472 (11%) | 3612 (10%) | 9082 (12%) | |
200K+ | 150 (3%) | 549 (1%) | 1303 (1%) | |
Highest Education Level | No Diploma | 476 | 6161 | 14669 |
Diploma or GED | 1689 | 15713 | 34861 | |
Some College | 1428 | 12188 | 26889 | |
Assoc. Degree | 749 | 5262 | 11970 | |
Bachelors Degree | 1107 | 8979 | 19847 | |
Higher Degree | 872 | 4253 | 9598 | |
Total Housing Units | 4,325 | 38,340 | 82,300 | |
--Owner-Occupied | 2,704 | 17,392 | 44,594 | |
--Renter-Occupied | 1,300 | 16,995 | 29,322 | |
Owner-Occupied Values | < 100K | 1474 | 9519 | 21628 |
100-199K | 1106 | 6973 | 18976 | |
200-299K | 88 | 524 | 2652 | |
300-399K | 9 | 197 | 785 | |
400-499K | 0 | 53 | 215 | |
500K+ | 27 | 126 | 339 | |
Total Working Age Population | 7,773 | 64,861 | 142,730 | |
In Work Force | 5,560 | 43,303 | 94,700 | |
Not In Work Force | 2,213 | 21,558 | 48,030 | |
Workforce Employed | 5,368 | 41,255 | 89,260 | |
Workforce Unemployed | 193 | 2,026 | 5,389 | |
Civlian Workforce | 5,560 | 43,281 | 94,649 | |
Military Workforce | 0 | 22 | 51 | |
Total Households | 4,004 | 34,387 | 73,916 | |
Family Households | 2,199 | 17,863 | 43,446 | |
Non-Family Households | 1,805 | 16,524 | 30,470 | |
Married Couple | 1,529 | 11,436 | 28,113 | |
Other Family | 670 | 6,426 | 15,333 | |
Married w/Child | 677 | 4,630 | 11,196 | |
Single Male w/Child | 187 | 1,165 | 2,316 | |
Single Female w/Child | 231 | 2,743 | 7,060 |
Population Change Last Two Decades - Plus Projection
2000 | % | 2010 | % | 2020 | % | 2030 | |
---|---|---|---|---|---|---|---|
Indiana | 6,080,485 | +7 | 6,483,802 | +4 | 6,738,573 | +4 | 7,014,880 |
Allen County | 331,849 | +7 | 355,329 | +7 | 379,671 | +6 | 402,948 |
Total Working Age Population:
Total Households:
Total Working Age Population:
Total Households:
Total Working Age Population:
Total Households: