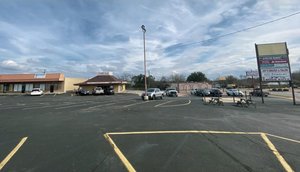
1-Mile | 3-Miles | 5-Miles | ||
---|---|---|---|---|
Total Population | 17,059 | 83,325 | 240,491 | |
Population Median Age | 32 | 36 | 35 | |
Population by Age | 0-9 Yrs | 3236 (18%) | 13226 (15%) | 38286 (15%) |
10-19 Yrs | 2470 (14%) | 12751 (15%) | 37125 (15%) | |
20-29 Yrs | 2988 (17%) | 11362 (13%) | 34065 (14%) | |
30-39 Yrs | 2169 (12%) | 11041 (13%) | 32990 (13%) | |
40-49 Yrs | 1839 (10%) | 9199 (11%) | 27883 (11%) | |
50-59 Yrs | 2266 (13%) | 10251 (12%) | 27677 (11%) | |
60-69 Yrs | 1269 (7%) | 8658 (10%) | 23688 (9%) | |
70+ Yrs | 821 (4%) | 6838 (8%) | 18776 (7%) | |
Median HH Income | $34,224 | $42,725 | $47,783 | |
Total Household Income | < 24K | 2511 (36%) | 8531 (28%) | 20346 (25%) |
25-49K | 2325 (34%) | 9055 (29%) | 22015 (27%) | |
50-74K | 961 (14%) | 5016 (16%) | 14770 (18%) | |
75-99K | 529 (7%) | 3203 (10%) | 9831 (12%) | |
100-199K | 488 (7%) | 3835 (12%) | 12311 (15%) | |
200K+ | 19 (0%) | 767 (2%) | 1953 (2%) | |
Highest Education Level | No Diploma | 1833 | 9081 | 31111 |
Diploma or GED | 3128 | 14814 | 41727 | |
Some College | 3009 | 13602 | 36642 | |
Assoc. Degree | 709 | 3589 | 9511 | |
Bachelors Degree | 815 | 6336 | 18199 | |
Higher Degree | 347 | 4011 | 10424 | |
Total Housing Units | 7,467 | 32,980 | 87,309 | |
--Owner-Occupied | 1,593 | 13,483 | 41,805 | |
--Renter-Occupied | 5,241 | 16,923 | 39,420 | |
Owner-Occupied Values | < 100K | 510 | 2954 | 9838 |
100-199K | 991 | 7741 | 22142 | |
200-299K | 48 | 1656 | 7028 | |
300-399K | 0 | 672 | 1772 | |
400-499K | 0 | 284 | 507 | |
500K+ | 43 | 177 | 518 | |
Total Working Age Population | 12,356 | 62,343 | 179,622 | |
In Work Force | 8,444 | 39,134 | 113,996 | |
Not In Work Force | 3,912 | 23,209 | 65,625 | |
Workforce Employed | 7,678 | 36,037 | 106,133 | |
Workforce Unemployed | 742 | 3,072 | 7,818 | |
Civlian Workforce | 8,421 | 39,109 | 113,951 | |
Military Workforce | 23 | 25 | 45 | |
Total Households | 6,834 | 30,406 | 81,225 | |
Family Households | 3,575 | 19,556 | 55,523 | |
Non-Family Households | 3,259 | 10,850 | 25,702 | |
Married Couple | 1,453 | 9,831 | 31,693 | |
Other Family | 2,122 | 9,725 | 23,830 | |
Married w/Child | 638 | 3,695 | 12,539 | |
Single Male w/Child | 258 | 1,052 | 2,530 | |
Single Female w/Child | 1,194 | 4,589 | 10,348 |
Population Change Last Two Decades - Plus Projection
2000 | % | 2010 | % | 2020 | % | 2030 | |
---|---|---|---|---|---|---|---|
Texas | 20,851,820 | +21 | 25,145,561 | +18 | 29,677,668 | +18 | 34,894,452 |
Dallas County | 2,218,899 | +7 | 2,368,139 | +15 | 2,734,111 | +14 | 3,106,298 |
Total Working Age Population:
Total Households:
Total Working Age Population:
Total Households:
Total Working Age Population:
Total Households: