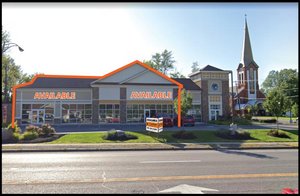
Retail Space
2275 West Ridge Road Rochester, NY 14626
2275 West Ridge Road Rochester, NY 14626

Details & Description
Property Highlights
• TWO TENANT BUILDING LOCATED IN THE MAIN RETAIL CORRIDOR OF GREECE, NY
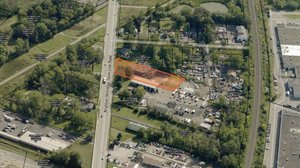
• SITE SITS IN FRONT OF THE MALL AT GREECE RIDGE
Listing Agents

Jacob Rivera
O: 585-454-4500
M: 310-650-4333
jrivera@caliberbrokerage.com
O: 585-454-4500
M: 310-650-4333
jrivera@caliberbrokerage.com
While we strive to provide the most accurate information, all listing information, and demographic data, is provided by third-parties. As such, MyEListing will not be responsible for the accuracy of the information. It is strongly recommended that you verify all information with the listing agent, and any relevant agencies, prior to making any decisions.