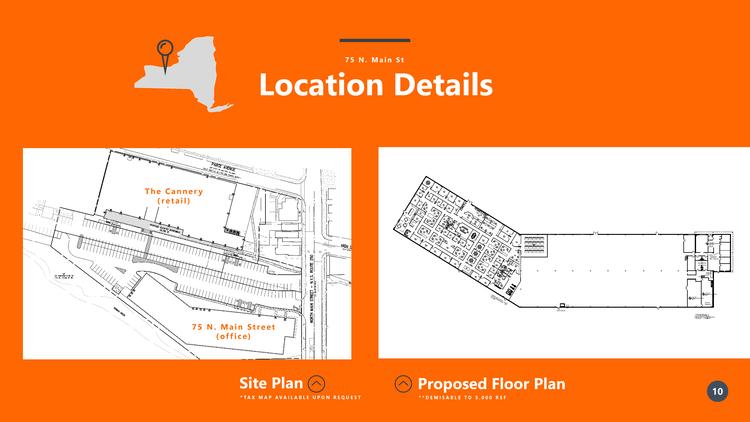
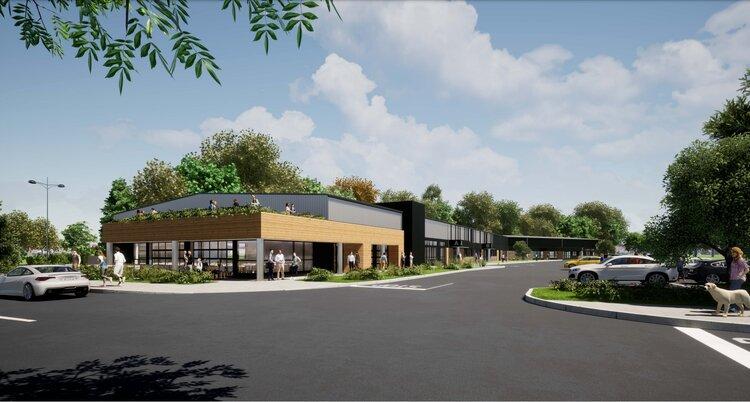
1-Mile | 3-Miles | 5-Miles | ||
---|---|---|---|---|
Total Population | 9,809 | 56,557 | 101,278 | |
Population Median Age | 42 | 43 | 42 | |
Population by Age | 0-9 Yrs | 1004 (10%) | 6083 (10%) | 11154 (11%) |
10-19 Yrs | 1179 (12%) | 6379 (11%) | 13486 (13%) | |
20-29 Yrs | 1143 (11%) | 5593 (9%) | 9507 (9%) | |
30-39 Yrs | 995 (10%) | 6449 (11%) | 11186 (11%) | |
40-49 Yrs | 1231 (12%) | 6593 (11%) | 11750 (11%) | |
50-59 Yrs | 1592 (16%) | 8620 (15%) | 15147 (14%) | |
60-69 Yrs | 1316 (13%) | 8057 (14%) | 14372 (14%) | |
70+ Yrs | 1349 (13%) | 8782 (15%) | 14675 (14%) | |
Median HH Income | $68,662 | $74,654 | $85,769 | |
Total Household Income | < 24K | 880 (20%) | 3532 (14%) | 4830 (11%) |
25-49K | 645 (15%) | 4172 (17%) | 6536 (16%) | |
50-74K | 823 (19%) | 4371 (18%) | 6799 (16%) | |
75-99K | 570 (13%) | 3132 (13%) | 5078 (12%) | |
100-199K | 1084 (25%) | 6946 (28%) | 12803 (31%) | |
200K+ | 287 (6%) | 1883 (7%) | 4660 (11%) | |
Highest Education Level | No Diploma | 482 | 1977 | 2791 |
Diploma or GED | 1322 | 6174 | 9402 | |
Some College | 1141 | 6771 | 10260 | |
Assoc. Degree | 754 | 4615 | 7536 | |
Bachelors Degree | 1928 | 12393 | 21742 | |
Higher Degree | 1625 | 9593 | 20025 | |
Total Housing Units | 4,496 | 25,508 | 43,263 | |
--Owner-Occupied | 2,906 | 18,292 | 32,486 | |
--Renter-Occupied | 1,383 | 5,745 | 8,220 | |
Owner-Occupied Values | < 100K | 68 | 1625 | 2393 |
100-199K | 1569 | 8623 | 13029 | |
200-299K | 1033 | 5918 | 10782 | |
300-399K | 112 | 1487 | 3947 | |
400-499K | 59 | 366 | 1227 | |
500K+ | 66 | 273 | 1108 | |
Total Working Age Population | 8,082 | 46,294 | 82,395 | |
In Work Force | 5,097 | 29,443 | 52,308 | |
Not In Work Force | 2,985 | 16,852 | 30,087 | |
Workforce Employed | 4,949 | 28,478 | 50,633 | |
Workforce Unemployed | 148 | 957 | 1,658 | |
Civlian Workforce | 5,097 | 29,435 | 52,291 | |
Military Workforce | 0 | 8 | 17 | |
Total Households | 4,290 | 24,037 | 40,706 | |
Family Households | 2,690 | 15,761 | 27,848 | |
Non-Family Households | 1,600 | 8,275 | 12,858 | |
Married Couple | 2,010 | 12,618 | 23,071 | |
Other Family | 680 | 3,144 | 4,777 | |
Married w/Child | 673 | 4,111 | 8,251 | |
Single Male w/Child | 23 | 391 | 642 | |
Single Female w/Child | 345 | 1,426 | 2,062 |
Population Change Last Two Decades - Plus Projection
2000 | % | 2010 | % | 2020 | % | 2030 | |
---|---|---|---|---|---|---|---|
New York | 18,976,457 | +2 | 19,378,102 | +4 | 20,146,131 | +2 | 20,604,030 |
Monroe County | 735,343 | +1 | 744,344 | +1 | 754,529 | +1 | 758,536 |
Ontario County | 100,224 | +8 | 107,931 | +3 | 111,349 | +3 | 114,374 |
Wayne County | 93,765 | 0 | 93,772 | -4 | 89,564 | -3 | 86,754 |
Total Working Age Population:
Total Households:
Total Working Age Population:
Total Households:
Total Working Age Population:
Total Households: