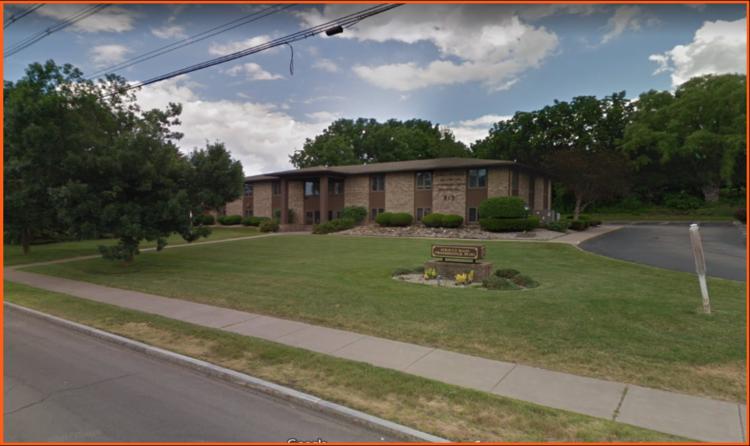
Office Space
815 Ayrault Road Fairport, NY 14450
815 Ayrault Road Fairport, NY 14450
Details & Description
Property Highlights
• Ayrault Professional Building-located near the intersection of Ayrault Road and Route 250 Moseley Road
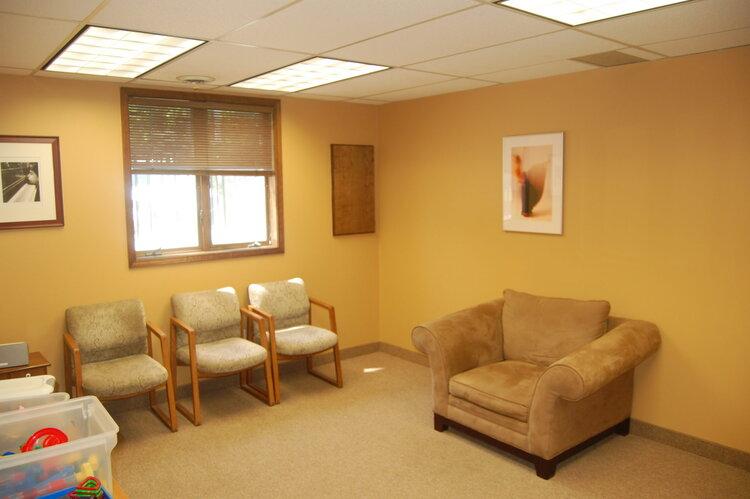
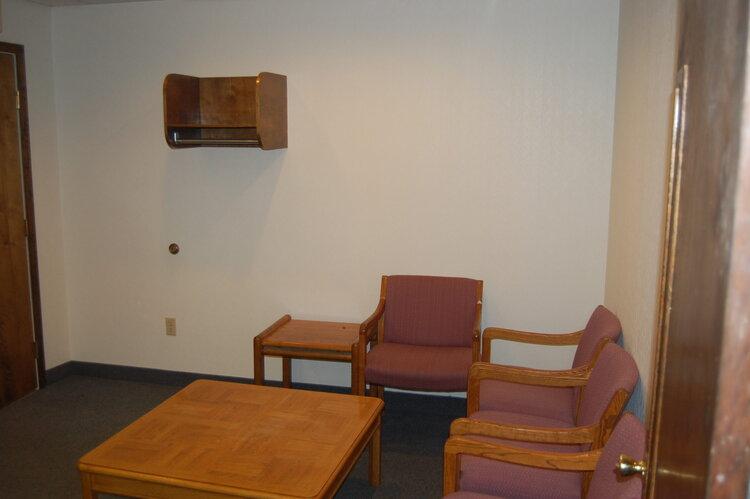
• Suite two consists of 750 SF located on the lower level of the building
Additional Photos

Listing Agents

Adam Pancione
O: 585-454-4500
apancione@caliberbrokerage.com
O: 585-454-4500
apancione@caliberbrokerage.com
While we strive to provide the most accurate information, all listing information, and demographic data, is provided by third-parties. As such, MyEListing will not be responsible for the accuracy of the information. It is strongly recommended that you verify all information with the listing agent, and any relevant agencies, prior to making any decisions.


