Brandywine Realty Trust advances its vision for the Cira Centre development—and growth within University City and Philadelphia as a whole—with FMC Tower at Cira Centre South. Spanning two decades of smart, sustained growth, Brandywine has set precedents for creativity in real estate—anticipating the future and delivering first-class solutions. We’ve evolved from initial ownership of four office buildings to now owning, managing, leasing and developing some of the nation’s most remarkable properties, inclusive of over $2.5 billion in successful development.
As the leading owner of Trophy and Class A office properties in Philadelphia, the Cira Centre South neighborhood is a crowning achievement—a visionary development offering an elevated tenant and resident experience while energizing its surrounding community.
Gateway to University City – Philadelphia’s most dynamic business and research district—where master-planned, innovation community developments are underway, namely Schuylkill Yards and the 30th Street Station District Plan.
Superior accessibility – close proximity to 30th Street Station, Interstates 76 and 676, Schuylkill River Trail and the PHL Airport (15 minutes by rail).
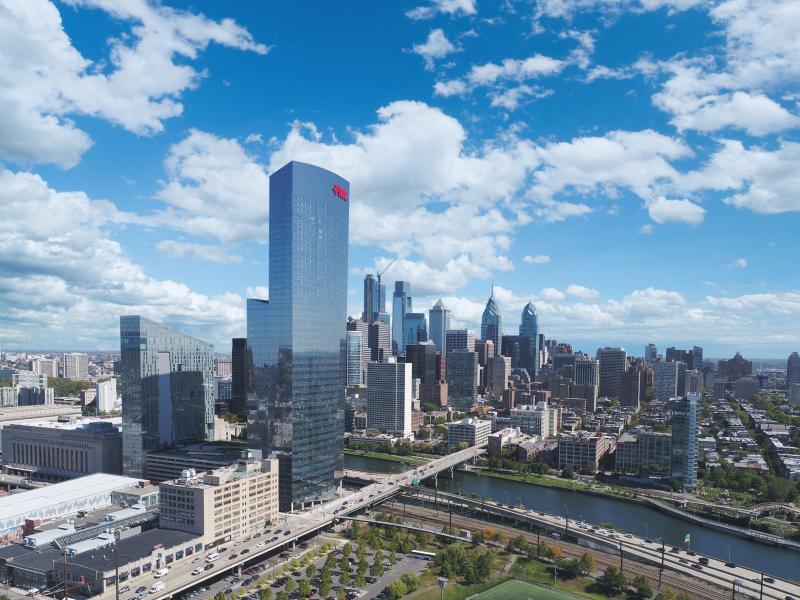
Philadelphia’s First Vertical Neighborhood– one progressively-designed, integrated environment in a 49-story, 725’ tower— comprised of office, residential / hotel, retail / restaurant, amenity and elevated outdoor space.
Sky Deck: Soaring outdoor sky deck with stunning city views, water features and fire pits.
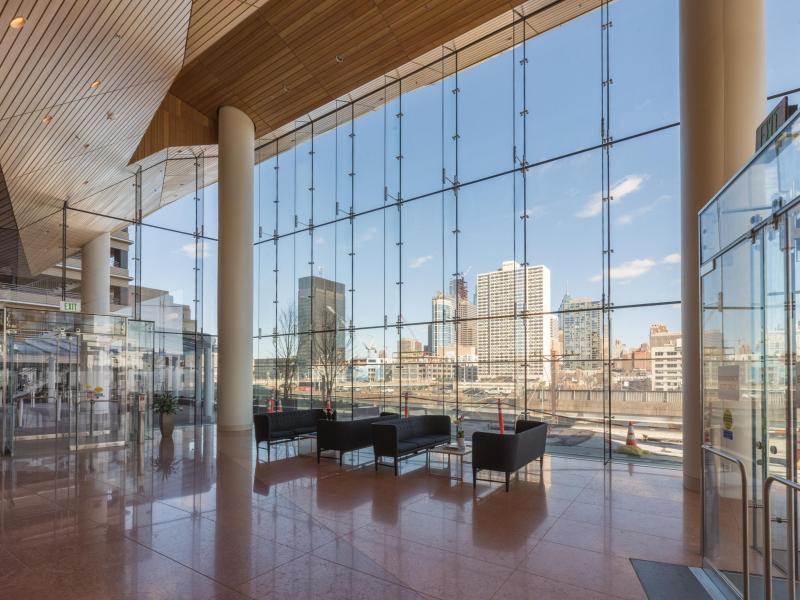
Sky lounge with airy, light-filled space for gathering or individual use.
Golf Simulator: 3D golf simulator for indoor practice and enjoyment.
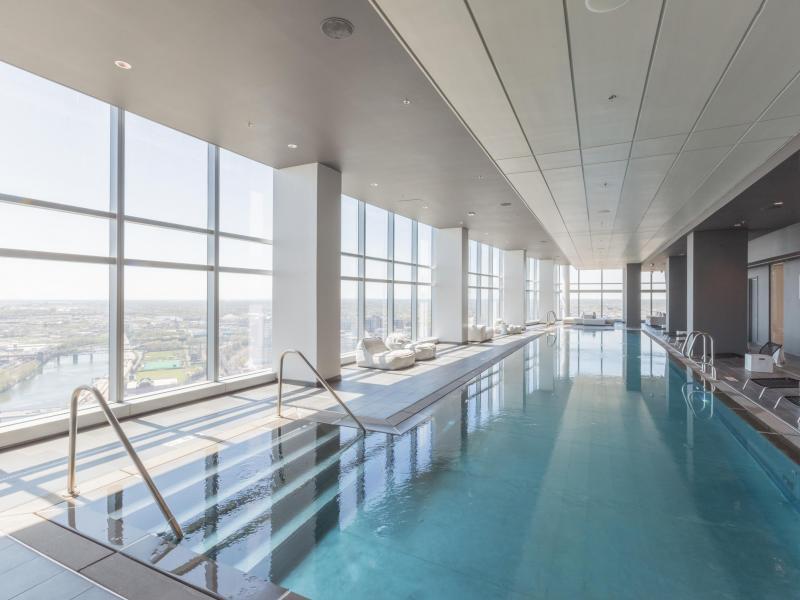
Spa: World-class spa with hydrotherapy and aromatherapy treatments.
Shower/Locker Facilities: Elegant shower and locker facility with hotel-style laundry and towel service.
Wellness Center: Fitness center featuring Technogym equipment, studio for yoga and other classes, and offering personal training plus innovative fitness events and programs.