Office Space
2929 Arch Street Philadelphia, PA 19104
2929 Arch Street Philadelphia, PA 19104

Details & Description
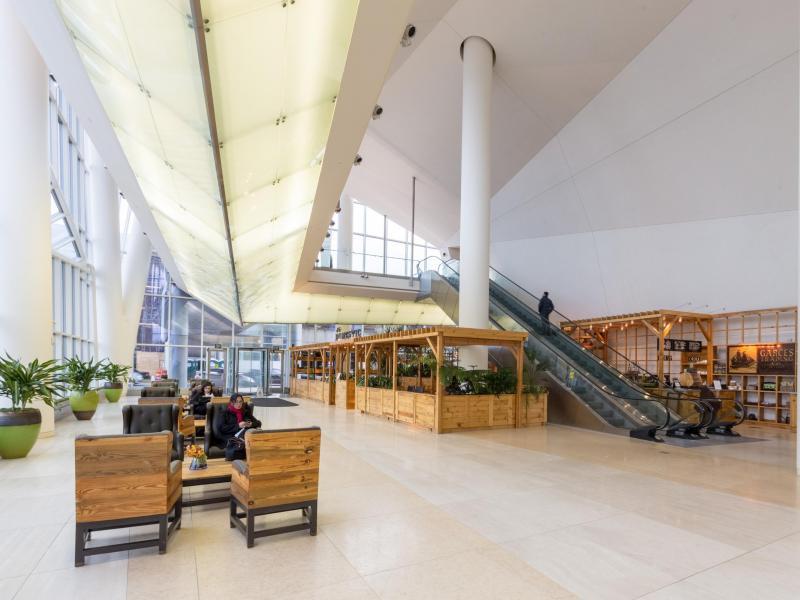
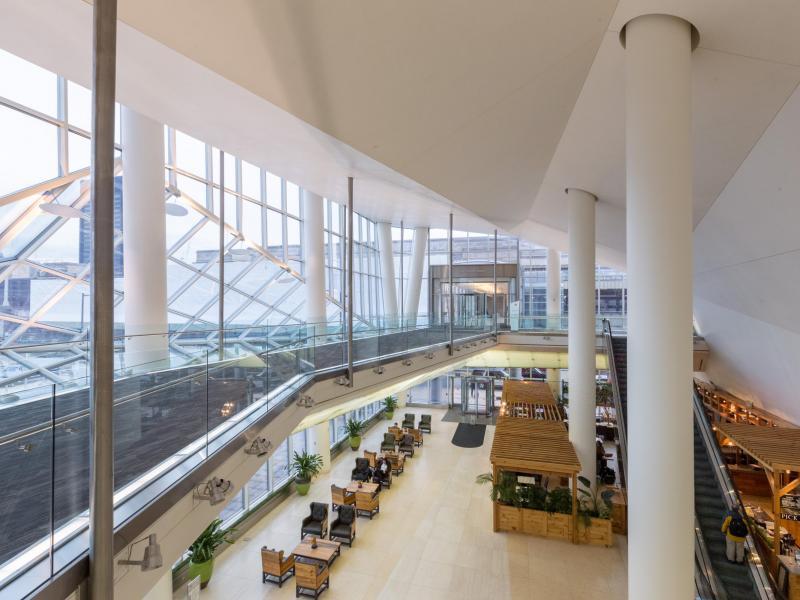
Property Highlights
• Continuous round trip shuttle service to and from Center City
• JG Domestic a premier restaurant from chef Jose Garces
Listing Agents

Steve Rush
O: 215-397-1562
steve.rush@bdnreit.com
O: 215-397-1562
steve.rush@bdnreit.com
While we strive to provide the most accurate information, all listing information, and demographic data, is provided by third-parties. As such, MyEListing will not be responsible for the accuracy of the information. It is strongly recommended that you verify all information with the listing agent, and any relevant agencies, prior to making any decisions.