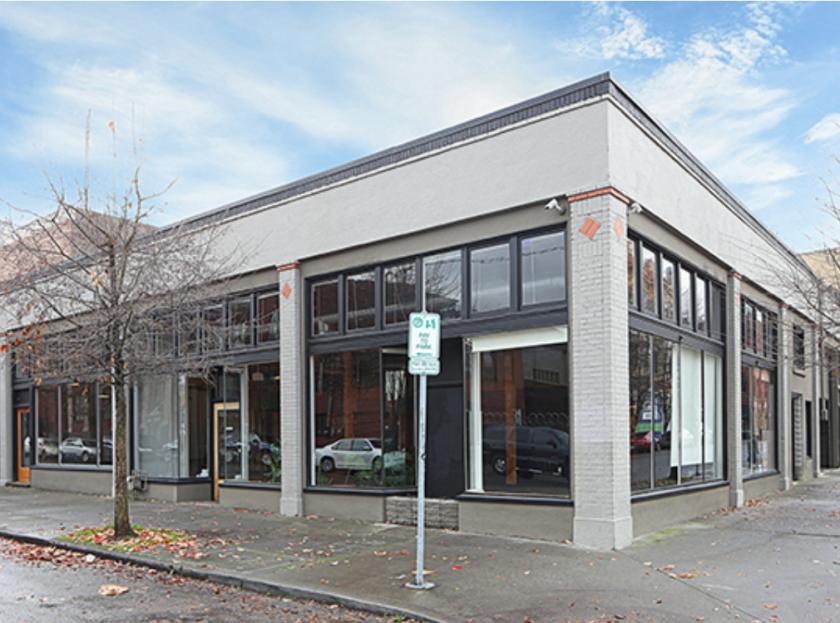
1-Mile | 3-Miles | 5-Miles | ||
---|---|---|---|---|
Total Population | 22,615 | 221,227 | 461,025 | |
Population Median Age | 41 | 39 | 39 | |
Population by Age | 0-9 Yrs | 868 (3%) | 16544 (7%) | 43101 (9%) |
10-19 Yrs | 625 (2%) | 14991 (6%) | 38013 (8%) | |
20-29 Yrs | 5214 (23%) | 42472 (19%) | 75653 (16%) | |
30-39 Yrs | 6119 (27%) | 48925 (22%) | 94978 (20%) | |
40-49 Yrs | 3042 (13%) | 32506 (14%) | 69399 (15%) | |
50-59 Yrs | 2593 (11%) | 24595 (11%) | 52871 (11%) | |
60-69 Yrs | 2443 (10%) | 23618 (10%) | 50116 (10%) | |
70+ Yrs | 1712 (7%) | 17576 (7%) | 36894 (8%) | |
Median HH Income | $50,391 | $74,152 | $76,105 | |
Total Household Income | < 24K | 3858 (29%) | 21175 (19%) | 35624 (17%) |
25-49K | 2618 (20%) | 18045 (16%) | 34202 (16%) | |
50-74K | 1856 (14%) | 15966 (14%) | 31639 (15%) | |
75-99K | 1387 (10%) | 12167 (11%) | 26122 (12%) | |
100-199K | 2291 (17%) | 28122 (25%) | 54006 (26%) | |
200K+ | 995 (7%) | 13875 (12%) | 23648 (11%) | |
Highest Education Level | No Diploma | 894 | 5736 | 16508 |
Diploma or GED | 2377 | 15945 | 40679 | |
Some College | 4623 | 30201 | 66142 | |
Assoc. Degree | 917 | 9271 | 21000 | |
Bachelors Degree | 6767 | 65541 | 121815 | |
Higher Degree | 4116 | 48957 | 86732 | |
Total Housing Units | 14,459 | 118,706 | 219,531 | |
--Owner-Occupied | 2,230 | 42,969 | 103,823 | |
--Renter-Occupied | 10,775 | 66,381 | 101,418 | |
Owner-Occupied Values | < 100K | 32 | 419 | 1574 |
100-199K | 22 | 497 | 2767 | |
200-299K | 262 | 2590 | 11689 | |
300-399K | 304 | 5503 | 20630 | |
400-499K | 330 | 7716 | 21216 | |
500K+ | 1280 | 26242 | 45947 | |
Total Working Age Population | 21,335 | 196,198 | 395,870 | |
In Work Force | 14,562 | 142,222 | 284,161 | |
Not In Work Force | 6,773 | 53,976 | 111,710 | |
Workforce Employed | 13,762 | 136,195 | 271,604 | |
Workforce Unemployed | 754 | 5,939 | 12,396 | |
Civlian Workforce | 14,516 | 142,135 | 284,000 | |
Military Workforce | 46 | 87 | 161 | |
Total Households | 13,005 | 109,350 | 205,241 | |
Family Households | 2,779 | 41,597 | 95,784 | |
Non-Family Households | 10,226 | 67,752 | 109,458 | |
Married Couple | 2,307 | 34,451 | 75,517 | |
Other Family | 472 | 7,146 | 20,267 | |
Married w/Child | 576 | 12,609 | 29,737 | |
Single Male w/Child | 76 | 991 | 2,883 | |
Single Female w/Child | 160 | 2,709 | 7,465 |
Population Change Last Two Decades - Plus Projection
2000 | % | 2010 | % | 2020 | % | 2030 | |
---|---|---|---|---|---|---|---|
Oregon | 3,421,399 | +12 | 3,831,074 | +11 | 4,264,810 | +11 | 4,727,438 |
Clackamas County | 338,391 | +11 | 375,992 | +14 | 428,860 | +14 | 490,011 |
Multnomah County | 660,486 | +11 | 735,334 | +12 | 822,675 | +10 | 906,904 |
Washington County | 445,342 | +19 | 529,710 | +17 | 619,337 | +16 | 718,633 |
Washington | 5,894,121 | +14 | 6,724,540 | +14 | 7,638,415 | +11 | 8,503,178 |
Clark County | 345,238 | +23 | 425,363 | +17 | 499,400 | +16 | 576,879 |
Total Working Age Population:
Total Households:
Total Working Age Population:
Total Households:
Total Working Age Population:
Total Households: