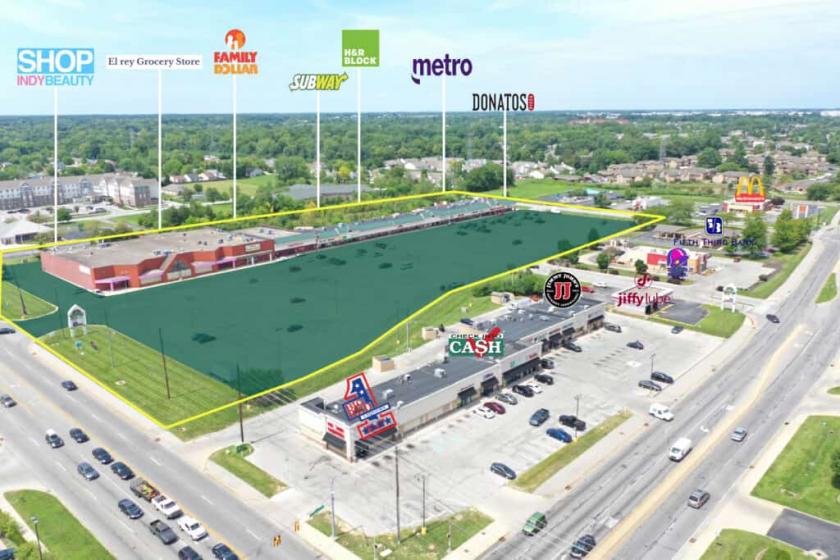
Retail Space
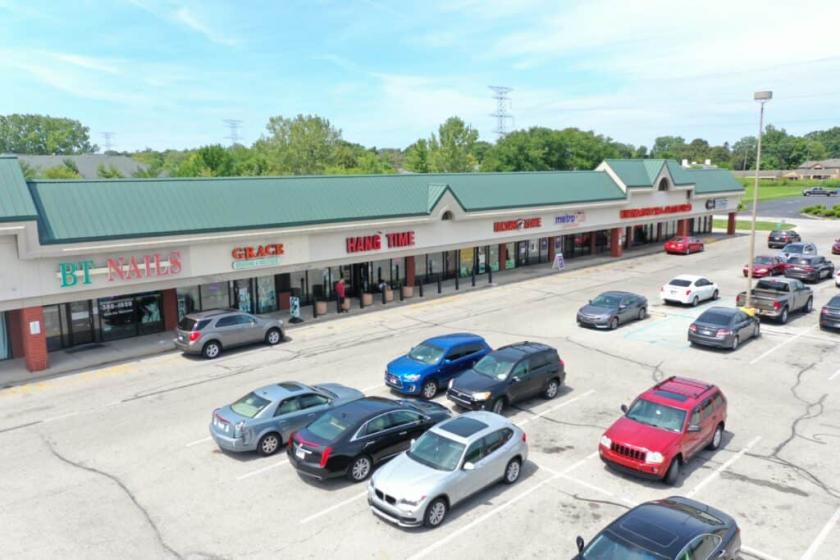
5620 Georgetown Road Indianapolis, IN 46254
5620 Georgetown Road Indianapolis, IN 46254
Details & Description
Property Highlights
- • Strong Recent Leasing Demand
- • Stabilized 100 Occupied
- • Below Market Rents
- • Family Dollar Junior Anchor
- • Priced Below Replacement Cost
- • New 10 Year Anchor Leases
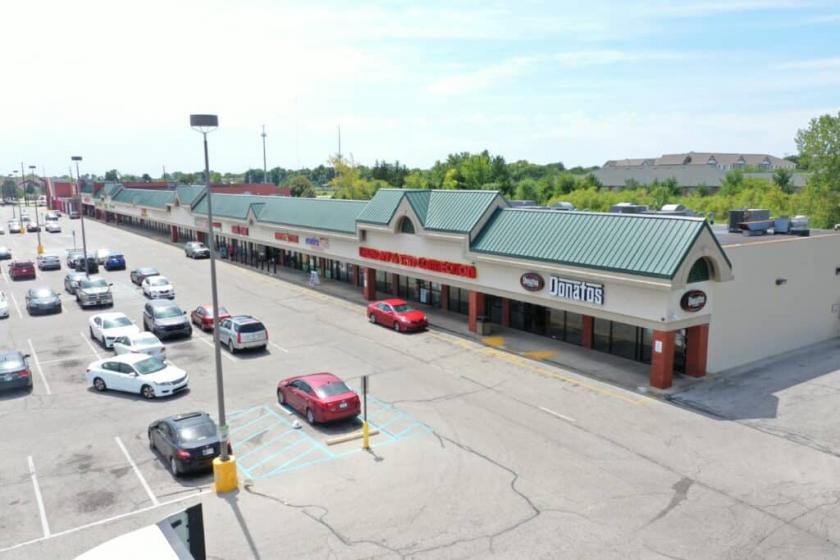
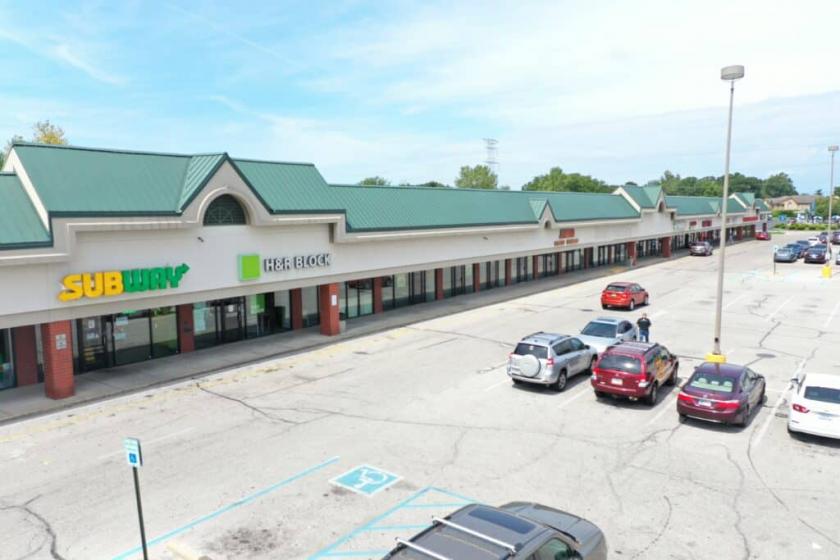
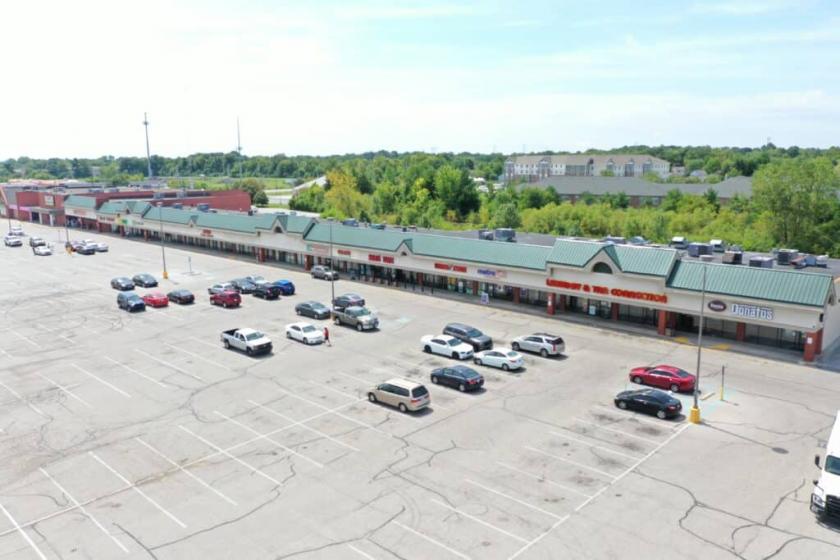
Additional Photos
Listing Agents

Rise Retail Group
Rise Retail Group
O: 317-844-0700
info@riseretailgroup.com
Rise Retail Group
O: 317-844-0700
info@riseretailgroup.com
While we strive to provide the most accurate information, all listing information, and demographic data, is provided by third-parties. As such, MyEListing will not be responsible for the accuracy of the information. It is strongly recommended that you verify all information with the listing agent, and any relevant agencies, prior to making any decisions.


