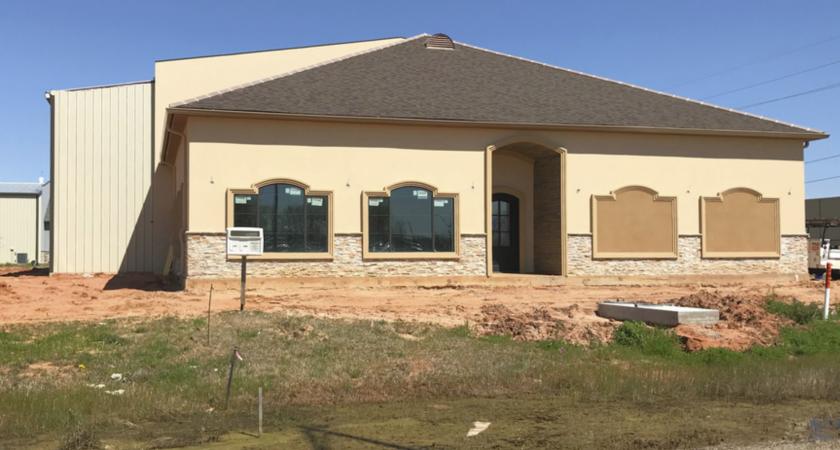
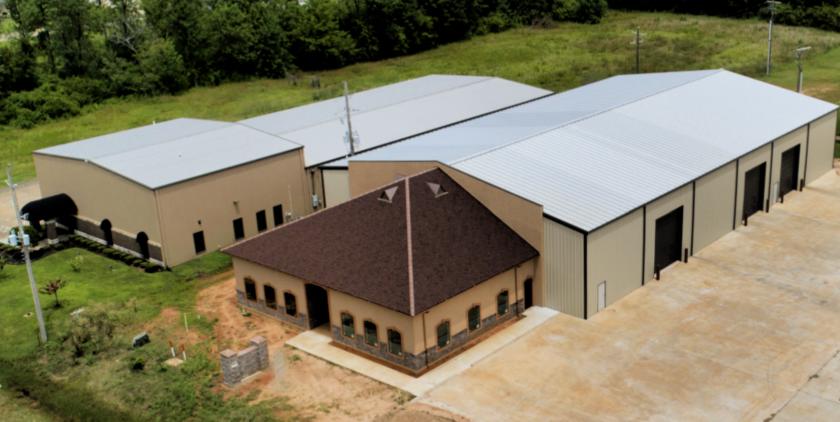
1-Mile | 3-Miles | 5-Miles | ||
---|---|---|---|---|
Total Population | 1,941 | 37,309 | 79,983 | |
Population Median Age | 42 | 37 | 36 | |
Population by Age | 0-9 Yrs | 188 (9%) | 5525 (14%) | 11418 (14%) |
10-19 Yrs | 200 (10%) | 5203 (13%) | 10726 (13%) | |
20-29 Yrs | 277 (14%) | 5356 (14%) | 12973 (16%) | |
30-39 Yrs | 327 (16%) | 5192 (13%) | 11699 (14%) | |
40-49 Yrs | 172 (8%) | 3871 (10%) | 8419 (10%) | |
50-59 Yrs | 227 (11%) | 4476 (11%) | 10007 (12%) | |
60-69 Yrs | 321 (16%) | 4097 (10%) | 7994 (9%) | |
70+ Yrs | 230 (11%) | 3589 (9%) | 6748 (8%) | |
Median HH Income | $40,823 | $44,983 | $45,057 | |
Total Household Income | < 24K | 314 (35%) | 4074 (27%) | 9459 (29%) |
25-49K | 174 (19%) | 4020 (26%) | 7840 (24%) | |
50-74K | 200 (22%) | 2499 (16%) | 5394 (16%) | |
75-99K | 135 (15%) | 1863 (12%) | 3852 (12%) | |
100-199K | 58 (6%) | 2055 (13%) | 4306 (13%) | |
200K+ | 7 (0%) | 477 (3%) | 1016 (3%) | |
Highest Education Level | No Diploma | 384 | 3197 | 6774 |
Diploma or GED | 474 | 7526 | 15047 | |
Some College | 272 | 6353 | 13637 | |
Assoc. Degree | 84 | 2293 | 4744 | |
Bachelors Degree | 92 | 3051 | 7384 | |
Higher Degree | 107 | 1845 | 4419 | |
Total Housing Units | 972 | 17,368 | 37,484 | |
--Owner-Occupied | 296 | 7,191 | 15,098 | |
--Renter-Occupied | 593 | 7,797 | 16,770 | |
Owner-Occupied Values | < 100K | 146 | 1581 | 3808 |
100-199K | 111 | 3054 | 6368 | |
200-299K | 24 | 1507 | 3105 | |
300-399K | 5 | 569 | 1027 | |
400-499K | 9 | 269 | 473 | |
500K+ | 2 | 210 | 317 | |
Total Working Age Population | 1,626 | 28,550 | 61,992 | |
In Work Force | 934 | 17,081 | 37,608 | |
Not In Work Force | 692 | 11,470 | 24,384 | |
Workforce Employed | 844 | 15,247 | 32,608 | |
Workforce Unemployed | 50 | 686 | 1,750 | |
Civlian Workforce | 894 | 15,933 | 34,357 | |
Military Workforce | 40 | 1,148 | 3,250 | |
Total Households | 889 | 14,988 | 31,868 | |
Family Households | 454 | 9,545 | 19,059 | |
Non-Family Households | 434 | 5,443 | 12,809 | |
Married Couple | 226 | 5,683 | 11,858 | |
Other Family | 228 | 3,862 | 7,201 | |
Married w/Child | 86 | 2,289 | 4,987 | |
Single Male w/Child | 21 | 454 | 918 | |
Single Female w/Child | 65 | 1,685 | 3,126 |
Population Change Last Two Decades - Plus Projection
2000 | % | 2010 | % | 2020 | % | 2030 | |
---|---|---|---|---|---|---|---|
Louisiana | 4,468,976 | +1 | 4,533,372 | +1 | 4,588,310 | +5 | 4,813,420 |
Bossier Parish | 98,310 | +19 | 116,979 | +8 | 126,780 | +11 | 141,350 |
Caddo Parish | 252,161 | +1 | 254,969 | -6 | 240,880 | -4 | 231,790 |
Total Working Age Population:
Total Households:
Total Working Age Population:
Total Households:
Total Working Age Population:
Total Households: